


You might be thinking, “Why bother with another Facebook analytics tool when I already have Facebook Insights?”
We understand where you’re coming from.
But here’s the deal.
By not using Facebook Analytics, you’re missing out on a huge opportunity to improve your ads and save money. It can even help you get more value from the money you’re already spending.
The truth is, that Facebook Analytics can completely transform the way you do business.
While Facebook Insights does a decent job of showing you how to find Facebook page insights in 2025, Facebook Analytics takes it a step further. It helps you see how people’s actions in the News Feed affect what they do on your website, app, or physical store. No more juggling different analytics tools for different platforms. With Facebook Analytics, you can see all your data in one place.
Still not sure? Don’t worry. We’ve created this guide to explain why you need Facebook Analytics and to help you learn how to use this powerful tool like a pro.

Facebook Analytics is a new tool for analyzing social media. It brings together all your Facebook pages, pixels, and apps to show you how people engage with them over time. It gives you a full view of how users interact with your different platforms.
For example, you can see how the audiences on your Facebook page and Facebook pixel overlap or connect. In simpler terms, you get to see how the people who follow your Facebook page also interact with your website, and how the visitors to your website engage with your Facebook page.
This is because Facebook Pixel, which is a key part of Facebook Analytics, helps track and analyze these interactions.
You’re probably familiar with Facebook Insights, which provides a report on how your Facebook Page is doing in terms of engagement and the demographics of your audience.
However, it’s important to understand that Facebook Insights and Facebook Analytics are two different tools.
Facebook Insights focuses solely on your Facebook Page and can be accessed within your Facebook Page itself. On the other hand, Facebook Analytics is mainly for paid ads and is available within your Facebook ad account.
Facebook Analytics collects detailed data from your Facebook Page and Facebook Pixel to show you how people interact with both your page and website over time. For example, you can see how many people commented on your Facebook post, visited your landing page, and then made a purchase.
In contrast, Facebook Insights is more focused on the reach of your Facebook Page, the performance of your posts, and other specific statistics that are limited to your Facebook Page.
Setting up Facebook Analytics may seem overwhelming for many marketers. But don’t worry, we’re here to help you every step of the way, and by the end of this guide, you’ll be a pro.
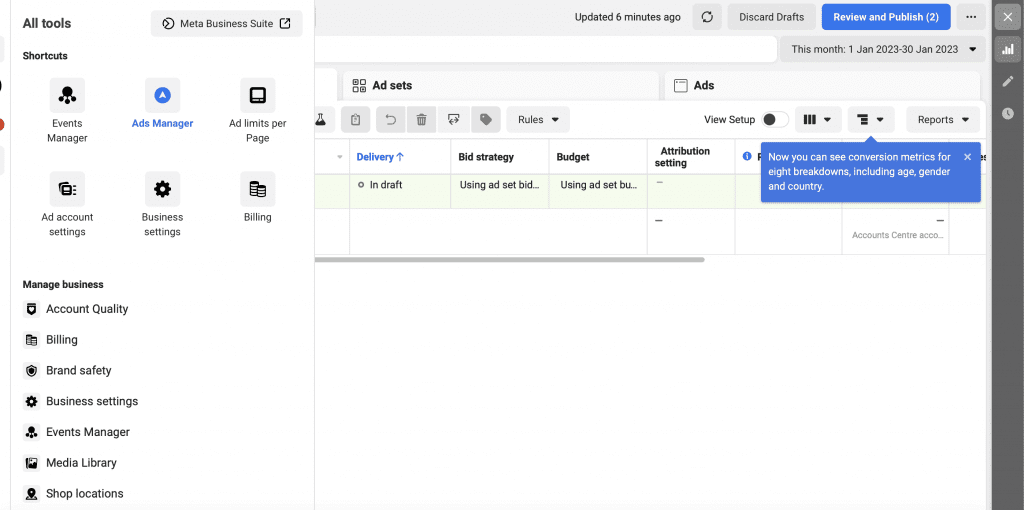
If you’re already using Business Manager, that’s great! You’re already ahead of the game.
To get started, go to your Business Manager account. Then, find the Analyze & Report Menu and click on Insights.

Understanding the Importance of Facebook Pixel for Your Analytics Dashboard
To make your Analytics dashboard work effectively, it’s essential to install the Facebook Pixel. The Facebook Pixel helps you identify who visits your website through interactions with your Facebook content.
With the Pixel in place, you can see how your Facebook ads bring visitors to your website and what actions they take once they’re there. This information is crucial as it allows you to measure how engaged your visitors are.
You can also compare the number of leads you generate with the cost of your ads, giving you a clear idea of how much it takes to acquire a lead. Additionally, you can identify which call-to-action buttons attract your visitors the most, enabling you to utilize them more effectively.
The Pixel also provides insights into shopping cart activity. You can track whether people are leaving items in their carts or completing the purchase process.
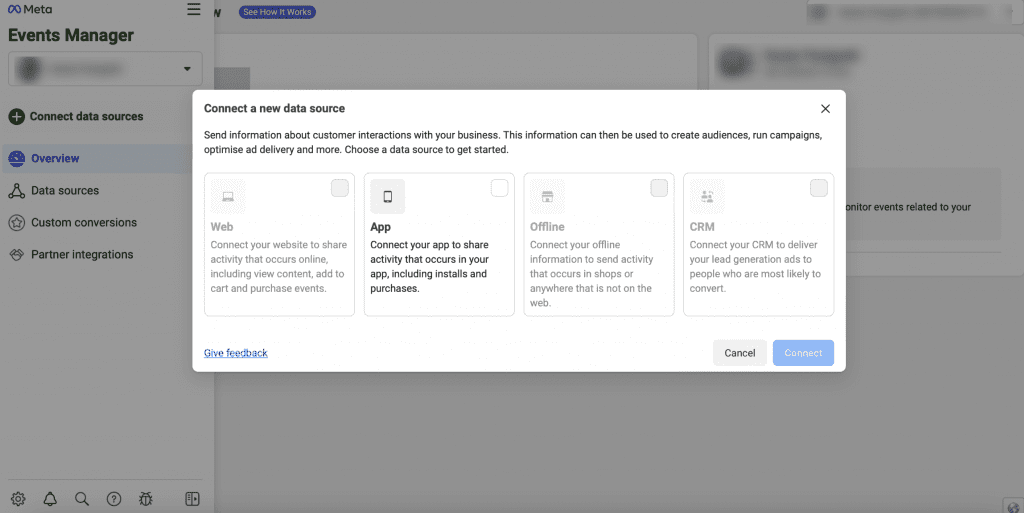
To find and install the Facebook Pixel, simply go to Ads Manager and click on “Pixels.” The installation process is straightforward, and Facebook will guide you through each step.
Once you’ve installed the Pixel, it needs some time to gather data. After a while, your dashboard will start filling up with analytics information.
At the top of your dashboard, you’ll find important metrics such as the number of new users, unique users, and your retention rate. The retention rate shows the percentage of people who come back to your site.
You can also check the number of active users you’ve had in the past 24 hours and identify your best sources of traffic under Growth Metrics.
Another crucial step after setting up your Pixel is customizing your Event Source Group (ESG). This lets you see analytics from all your assets, including Pages, websites, and apps.
To create your event source group, look for the option in the top right-hand corner. Then, give it a name and select the apps, pixels, and pages you want to include in your reports. Just follow the setup instructions, and your dashboard will be ready to go.
No matter how great your campaign may seem, it’s essential to analyze the performance of your Facebook ads. This way, you’ll have a clear understanding of how they’re performing and what areas need improvement.
Enter Facebook Analytics, the ultimate tool for advertising on Facebook. This powerful tool provides you with a wealth of data from your ads.
To maximize the benefits of Facebook Analytics it’s crucial to grasp three key components. Let’s explore them in more detail.
One valuable feature in Facebook Analytics is Funnels, which provides important insights into user behavior. To access the Funnels dashboard, follow these steps:
Add all the relevant events to capture the data you need for accurate insights.
By using Funnels in Facebook Analytics, you can gain a deeper understanding of how users progress through specific actions, helping you identify areas for optimization and improvement.
Another useful report in Facebook Analytics is the Customer Lifetime Value (CLTV). To set it up, follow these steps:
The Customer Lifetime Value report provides valuable insights into the long-term value of your customers. It helps you understand the revenue generated by different user segments and enables you to make informed decisions about marketing strategies, customer retention, and improving overall profitability.
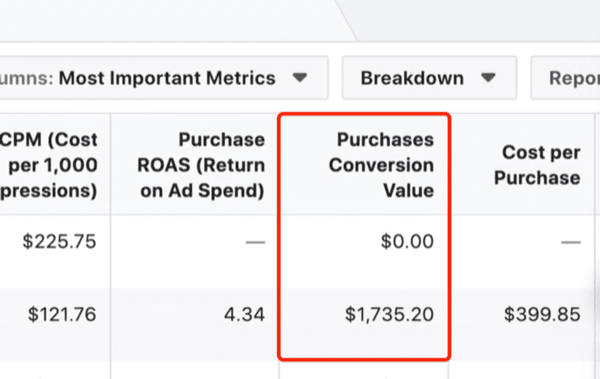
Another crucial insight in Facebook Analytics is Revenue, which provides valuable information about the financial aspect of your business. To set it up, follow these simple steps:
The revenue report offers valuable Facebook audience insights. It allows you to see the number of people who have made purchases and provides a breakdown of their age and gender.
By understanding the demographics of the people who are making the most purchases, you can fine-tune your Facebook ads and target them more effectively. This enables you to maximize the value of your ad spend and achieve better results for your business.
Let Vaizle revolutionize your social media analytics with its real-time conversation-tracking capabilities. Designed for platforms like Facebook, Twitter, Instagram, and more, Vaizle provides in-depth analytics for social media, keywords, and hashtags.
While Facebook Insights offers limited metrics specific to your brand, Vaizle Facebook analytics tool takes it a step further by offering detailed analytics reports for any business page. Here’s what you can do with Vaizle:
The best part is that Vaizle is not limited to just Facebook. You can also explore profiles from other popular social media platforms and access detailed, actionable insights.
Get started for free and elevate your social media presence today!
To begin, access your Business Manager account. From there, go to the Analyze & Report menu and choose Insights. This is where you can access Facebook analytics specifically for your Facebook business page.
Facebook Analytics is an integrated tool designed to monitor and assess the performance of your social media content as time progresses. This tool provides valuable insights regarding your content’s reach, including metrics such as likes, comments, page views, and post impressions.
Vaizle is the best Facebook analytics tool. Some of its Features are
1. Track any public page
2. Spy on your competitors and analyze their performance
3. Monitor Facebook hashtags and keywords
4. Know how your audience feels with sentiment analysis
5. Use personalized recommendations to grow engagement and follower count
6. Create custom reports with vital metrics
Siddharth built two bootstrapped companies from the ground up: Vaizle and XOR Labs. He’s personally managed over Rs 100cr in ad budget across eCommerce, D2C, ed-tech, and health-tech segments. Apart from being a full-time marketer, he loves taking on the challenges of finance and operations. When not staring at his laptop, you’ll find him reading books or playing football on weekends.
Copyright @VAIZLE 2026