Did you know that there are over 10 million advertisers on Facebook alone? Needless to say, the platform boasts unmatched advertising potential and is the key area to focus on for upcoming brands and businesses all over the world.
But if you are new to the Facebook marketing landscape, you need to pick up a few things — including a proper understanding of key Facebook ad metrics and how you can track them using the Facebook Ads Manager.
Side by side, you also need to be aware of the market standards and latest Facebook ad benchmarks.
In this blog, we’ll discuss more about the Facebook benchmarks based on geographical region and industry in this blog.
Facebook Ads Benchmarks in 2025
If you’re running short on time and need quick insights, this section about key Facebook advertising benchmarks is going to be for you.Facebook Ads Benchmarks by Region (2025)
If you have more time, keep reading. We’ll break down benchmarks across individual metrics (like CTR, CPC, and ROAS), dive into industry-level and regional trends, and look at year-over-year changes to help you spot shifts in performance.
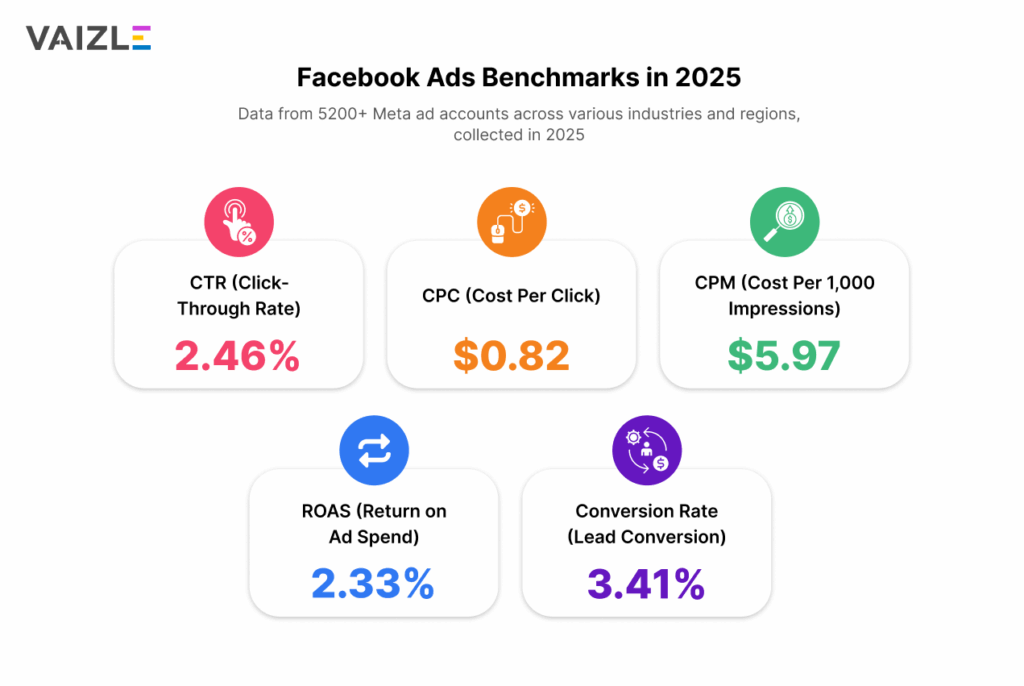
Below is a quick snapshot of global Facebook ads performance across thousands of campaigns. This includes median values, top 25% performance, and bottom 25% benchmarks for 2025.
Use this as a reference point to see where you stand and where top-performing advertisers are heading.
Here’s the 2025 Facebook Ads benchmarks snapshot:
Metric
Average
Top 25%
Bottom 25%
CTR (Click-Through Rate)
2.46%
3.06%
1.09%
CPC (Cost Per Click)
$0.82
$0.88
$0.11
CPM (Cost Per 1,000 Impressions)
$5.97
$6.81
$0.86
ROAS (Return on Ad Spend)
2.33
0.12
0.00
Conversion Rate (Lead Conversion)
3.41%
2.64%
0.00
Data from 5200+ Meta ad accounts across various industries and regions, collected in 2025
Each metric in this report comes with three values:
Average: Typical performance across all advertisers.
Top 25%: What the best-performing campaigns are achieving.
Bottom 25%: Where underperforming campaigns tend to land.
We recommend using top 25% numbers as your north star — not as pressure, but as inspiration. These campaigns often have better creative, tighter targeting, and stronger product-market fit. If you’re hitting or exceeding those numbers, you’re operating at an elite level.
Here’s what seems to be the general trend across various industries and regions in 2025.
CTR (Click-Through Rate) – If your ads are pulling in a CTR above 3%, you’re already in the top 25%. That means your creative is catching attention — likely through a strong hook rate, relevance, or format experimentation.
CPC (Cost Per Click) – Clicks are still cheap on Meta. If you’re paying under $1, you’re in a healthy range. But here’s the thing – low CPCs don’t always mean high intent. The best advertisers are balancing low cost with qualified traffic.
CPM (Cost Per 1,000 Impressions) – CPMs have held steady this year, with top-performing accounts willing to pay more for high-quality placements. Don’t stress over slightly higher CPMs if the click and conversion quality is strong.
ROAS (Return on Ad Spend) – The gap between average and great performance is widening. High-ROAS campaigns aren’t just about optimization — they’re about full-funnel clarity. What you promise in your ad needs to be delivered fast and frictionlessly post-click.
Conversion Rate (Lead Conversion) – A good CTR doesn’t guarantee conversions. The best-performing accounts are simplifying landing pages, reducing friction in forms, and offering something people actually want. If your lead forms are long or slow, you’re losing people.
Try AI to Analyze your Meta Ads ✨
Save hours. Let AI show you where your ads can do better ✅️
Now, let’s understand how adverts on Meta are performing across industries. This is important because industry matters more than most marketers realize.
A click-through rate that looks underwhelming in one vertical may be top-tier in another. Cost benchmarks shift depending on customer journeys, funnel length, product pricing, and competition. That’s why looking at Facebook ad metrics in isolation often leads to false alarms or over-optimism.
In this section, we break down median and top 25% performance across key industries so you can benchmark more meaningfully. Whether you’re running ads for e-commerce, SaaS, education, or real estate, these numbers offer a clearer picture of what “good” really looks like in your sector.
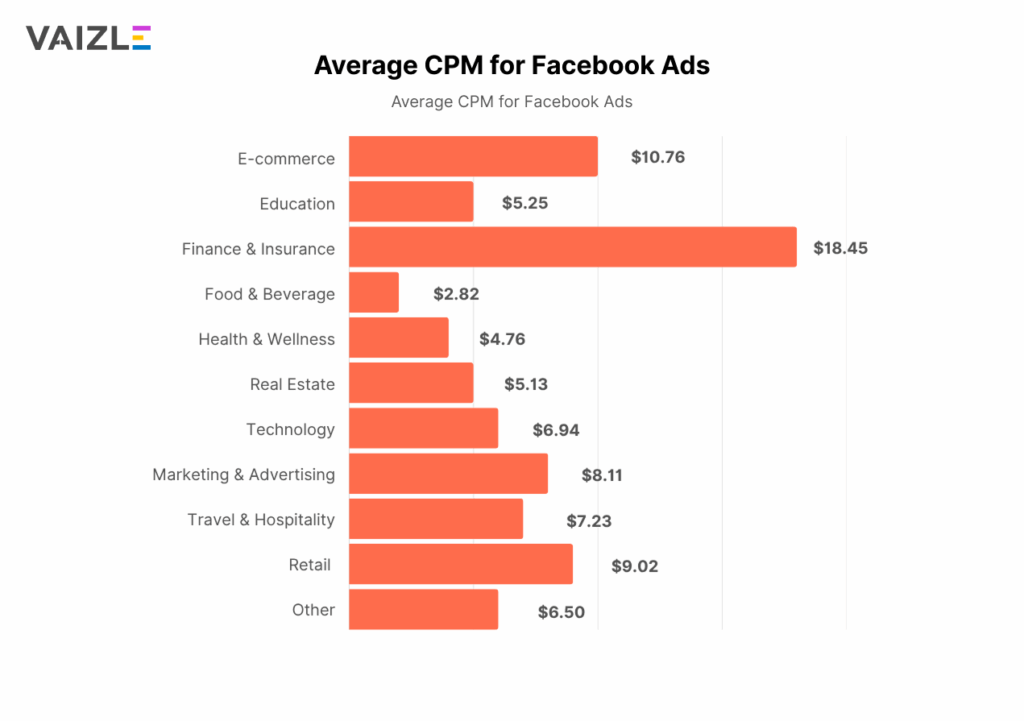
Average CPM for Facebook Ads
Cost Per 1,000 Impressions (CPM) is an important metric for understanding how much you’ll pay to get your ads seen by a broader audience. It gives insight into the cost-efficiency of campaigns, especially those focused on brand awareness or reach.
Industry
Average CPM
Top 25%
Bottom 25%
E-commerce
$10.76
$6.81
$0.86
Education
$5.25
$3.68
$0.92
Finance & Insurance
$18.45
$2.68
$0.51
Food & Beverage
$2.82
$0.86
$0.25
Health & Wellness
$4.76
$3.69
$1.00
Real Estate
$5.13
$3.80
$0.85
Technology
$6.94
$4.75
$1.50
Marketing & Advertising
$8.11
$5.00
$1.20
Travel & Hospitality
$7.23
$5.50
$2.60
Retail
$9.02
$6.10
$2.20
Other
$6.50
$4.25
$1.00
Key insights for CPM
E-commerce campaigns tend to have the highest CPM due to targeting more specific audiences with product-centric ads, often requiring higher bids for competitive targeting. To lower CPM, expanding target audiences and focusing on broader campaigns could help.
Finance & Insurance see extremely high CPM, likely due to the value of each lead (insurance policies, financial products), which justifies the higher cost. Here, tightening targeting could help reduce CPM and improve campaign efficiency.
Food & Beverage campaigns benefit from low CPM, as many of these campaigns target local audiences and capitalize on impulse purchases. To maintain or reduce CPM further, local targeting and promotions during peak hours can help.
Technology and Marketing & Advertising have moderate CPM values, suggesting that these sectors target a balance between broad visibility and specific audience reach.
Real Estate and Retail campaigns see medium to high CPM, with opportunities to reduce cost through better ad optimization and targeted offers.
Health & Wellness campaigns typically have mid-range CPM, indicating the need for more optimized targeting and conversion strategies to get the best value for money.
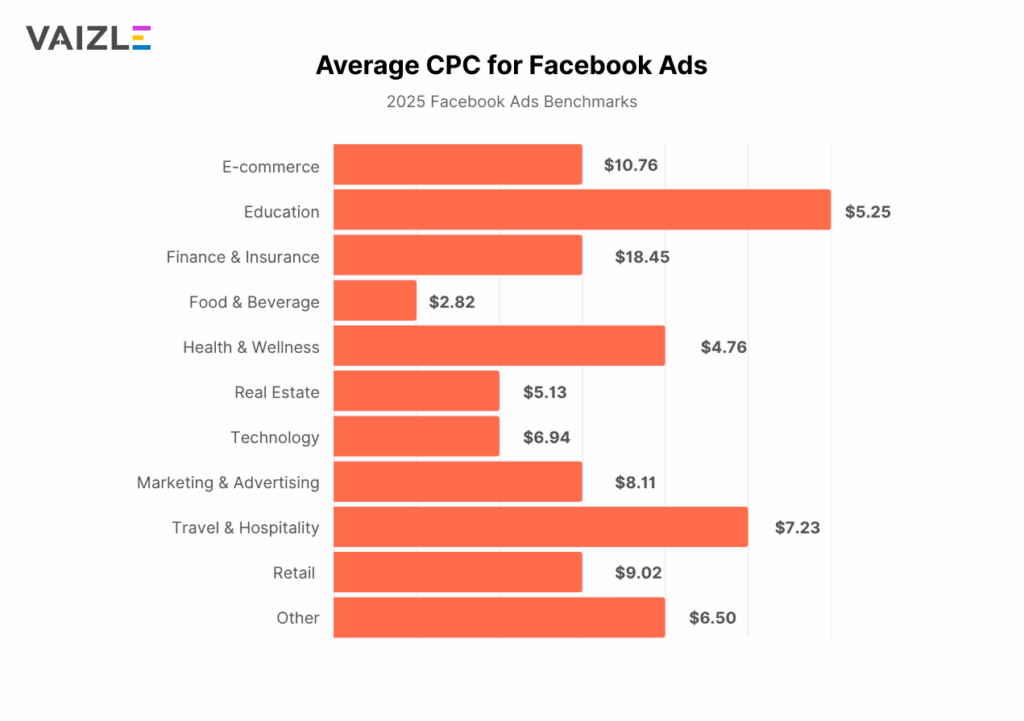
Average CPC for Facebook Ads
Cost Per Click (CPC) helps you understand how much you are paying for each click generated by your ad. It’s a key metric for performance marketers running direct-response or conversion-focused campaigns.
Lower CPC generally means more efficient ad spend – but the “ideal” CPC can vary widely by industry.
Industry
Average CPC
Top 25%
Bottom 25%
E-commerce
$1.37
$0.88
$0.11
Education
$0.70
$0.35
$0.10
Finance & Insurance
$2.34
$1.80
$0.95
Food & Beverage
$0.36
$0.21
$0.09
Health & Wellness
$1.48
$0.94
$0.50
Real Estate
$1.20
$0.75
$0.32
Technology
$1.10
$0.65
$0.20
Marketing & Advertising
$1.45
$1.00
$0.50
Travel & Hospitality
$1.88
$1.50
$0.80
Retail
$0.82
$0.55
$0.18
Other
$0.90
$0.60
$0.30
Key insights for CPC
High CPC in High-Value Industries:
Finance & Insurance campaigns show the highest CPC, with an average of $2.34. This makes sense, as these industries often target high-value customers (e.g., insurance buyers or financial investors) who are harder to reach. Due to the higher cost of reaching these valuable leads, the CPC increases. Advertisers in this industry may need to be strategic with their targeting to maximize ROI, ensuring that they focus on high-intent leads.
Lower CPC in E-commerce & Food Sectors:
E-commerce campaigns, which target a wide range of consumers, have a relatively lower CPC of $1.37, suggesting that advertisers in this sector are getting clicks efficiently. However, they still need to focus on ad relevance to ensure that clicks convert into purchases. For Food & Beverage campaigns, the CPC drops to just $0.36, reflecting their focus on local targeting or impulse buys where the audience is less competitive. Food advertisers might scale their campaigns easily due to the low cost per click.
Moderate CPC in Technology & Travel:
Technology campaigns show a moderate CPC of $1.10, which is expected in an industry where products like software or gadgets often target tech-savvy, informed buyers. This industry’s moderate CPC suggests a competitive bidding environment without reaching the high values seen in finance or retail.
Similarly, Travel & Hospitality campaigns have a higher CPC than Food & Beverage, with an average of $1.88. This is likely because travel-related services often cater to specific groups like tourists or business travelers, making targeting more expensive.
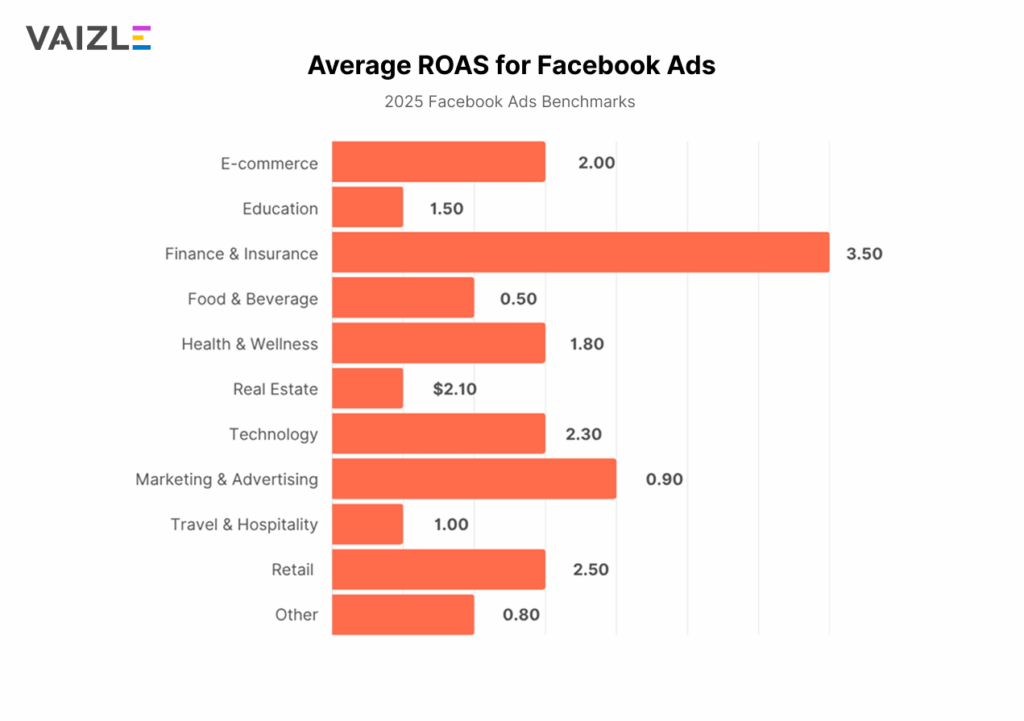
Average ROAS for Facebook Ads
ROAS is a critical metric for assessing how effectively your advertising spend is translating into revenue.
Industry
Average ROAS
Top 25%
Bottom 25%
E-commerce
2.00
4.50
0.10
Education
1.50
3.20
0.00
Finance & Insurance
3.50
6.00
0.20
Food & Beverage
0.50
1.20
0.00
Health & Wellness
1.80
3.40
0.00
Real Estate
2.10
4.00
0.50
Technology
2.30
5.00
0.10
Marketing & Advertising
0.90
1.50
0.00
Travel & Hospitality
1.00
2.00
0.00
Retail
2.50
5.00
0.30
Other
0.80
1.40
0.00
Key insights for ROAS
For e-commerce, Average ROAS of 2.00 suggests that campaigns are effectively turning ad spend into revenue. With an average ROAS above 1.0, these campaigns are generally profitable, but there’s room for improvement, especially for industries targeting niche markets.
Finance & Insurance campaigns deliver strong returns due to the high lifetime value of each customer (e.g., long-term insurance policies or investment products). These industries typically have a higher cost per lead, but the returns justify the expense.
Food & Beverage industries often face lower returns due to limited campaign objectives beyond immediate sales. Optimizing for direct conversions could improve ROAS.
Average ROAS of 0.90 indicates that Marketing & Advertising campaigns often struggle to convert ad spend into revenue. This is common in service-driven industries, where results may be more focused on leads or brand awareness rather than immediate sales.
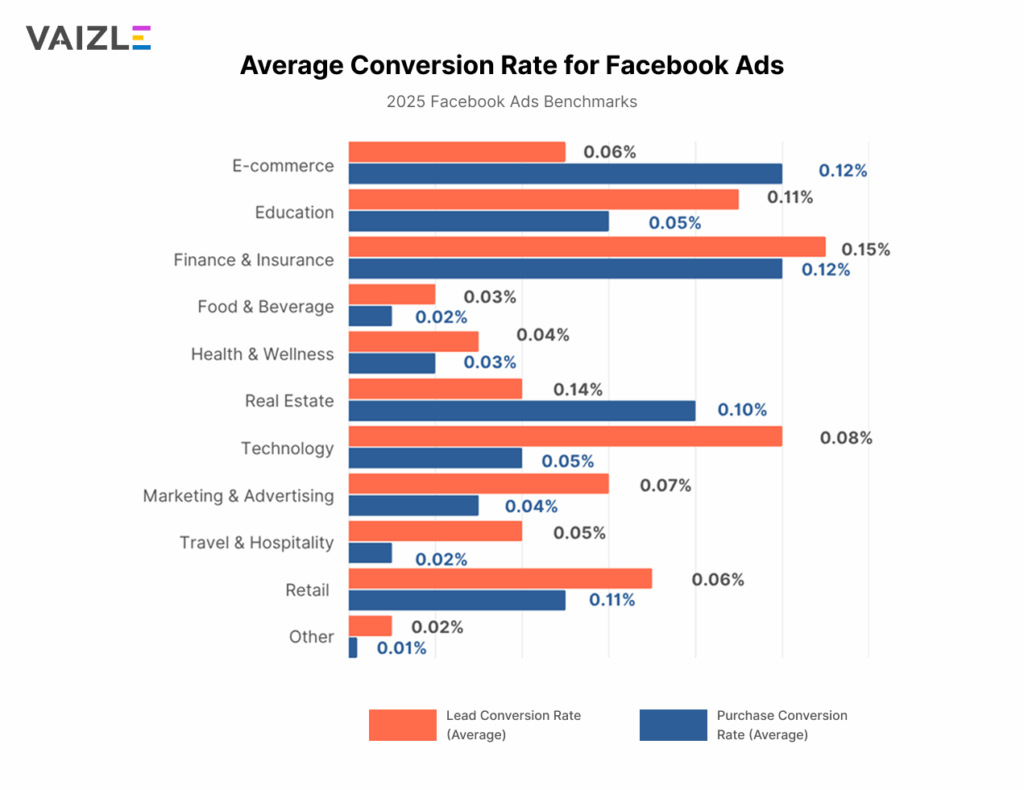
Average Conversion Rate for Facebook Ads
Industry
Lead Conversion Rate (Average)
Top 25% Lead Conversion Rate
Bottom 25% Lead Conversion Rate
Purchase Conversion Rate (Average)
Top 25% Purchase Conversion Rate
Bottom 25% Purchase Conversion Rate
E-commerce
0.06
0.15
0.01
0.12
0.30
0.02
Education
0.11
0.21
0.00
0.05
0.12
0.00
Finance & Insurance
0.15
0.28
0.05
0.12
0.25
0.03
Food & Beverage
0.03
0.09
0.00
0.02
0.05
0.00
Health & Wellness
0.04
0.12
0.00
0.03
0.09
0.00
Real Estate
0.14
0.35
0.05
0.10
0.22
0.02
Technology
0.08
0.18
0.02
0.05
0.13
0.00
Marketing & Advertising
0.07
0.12
0.01
0.04
0.08
0.00
Travel & Hospitality
0.05
0.12
0.00
0.02
0.06
0.00
Retail
0.06
0.15
0.02
0.11
0.28
0.00
Other
0.02
0.05
0.00
0.01
0.03
0.00
Key insights for Conversion Rates
Food & Beverage:
The low lead conversion rate (0.03%) and purchase conversion rate (0.02%) indicate that campaigns in this industry are mainly focused on brand awareness or local engagement, rather than direct conversions. Improved targeting could help drive better results.
Finance & Insurance:
Strong performance in lead conversion (0.15%) with moderate purchase conversion (0.12%). Finance ads are effectively generating leads, but there’s room to increase purchase conversion. This suggests that the sales funnel may need optimization for better follow-up and closure.
E-commerce:
The low lead conversion rate (0.06%) but relatively higher purchase conversion rate (0.12%) shows that E-commerce campaigns are better at converting people who are already interested in making a purchase. Improving lead generation could expand the potential customer base for E-commerce ads.
Moreover, we also see that Real Estate and Health & Wellness industries have strong lead generation but need to work on converting those leads into sales.
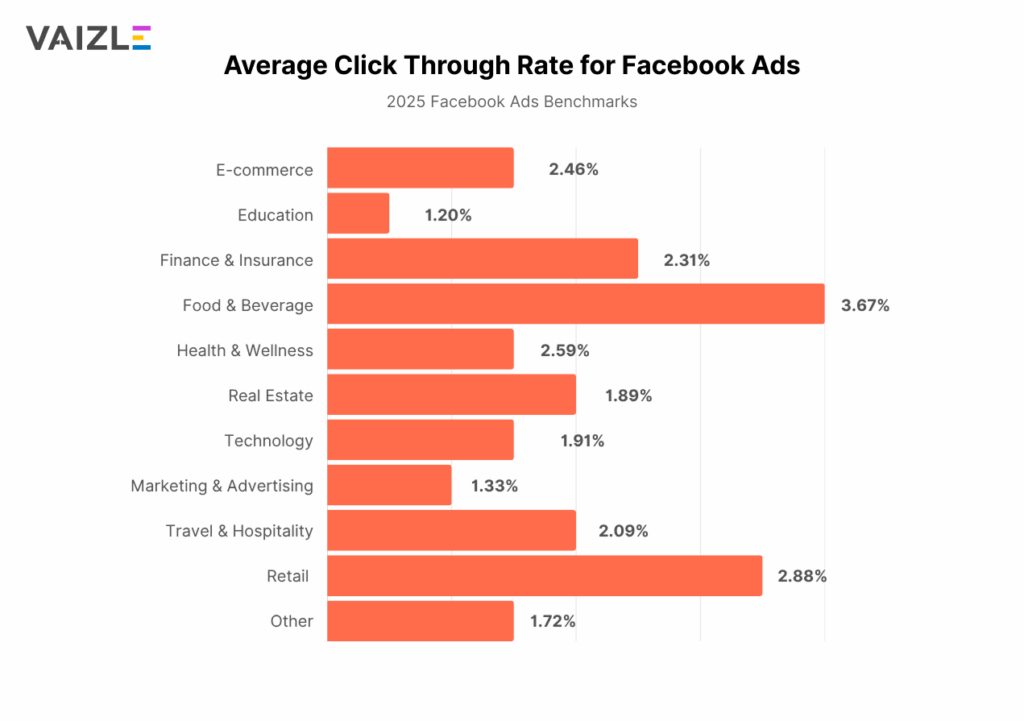
Average CTR for Facebook Ads
Click-Through Rate (CTR) measures the percentage of people who click on your ad after seeing it. This metric is particularly important for assessing ad relevance and audience targeting.
Industry
Average CTR
Top 25%
Bottom 25%
E-commerce
2.46%
3.06%
1.09%
Education
1.20%
1.80%
0.39%
Finance & Insurance
2.31%
3.80%
1.20%
Food & Beverage
3.67%
5.02%
2.15%
Health & Wellness
2.59%
3.76%
1.27%
Real Estate
1.89%
2.08%
1.51%
Technology
1.91%
2.63%
0.94%
Marketing & Advertising
1.33%
1.73%
0.94%
Travel & Hospitality
2.09%
3.00%
1.12%
Retail
2.88%
4.05%
1.35%
Other
1.72%
2.35%
1.04%
Key insights for Click-Through Rate (CTR)
Food & Beverage has the highest average CTR of 3.67%, which reflects how effective local targeting and impulse-driven ads are in this industry. The high engagement comes from a broad audience and compelling offers.
Education campaigns, with a CTR of 1.20%, likely face challenges engaging users due to longer decision cycles or targeting a broader audience. This suggests a need for better segmentation or personalized offers to boost engagement.
Real Estate campaigns show a CTR of 1.89%, which is decent considering the higher-intent nature of the audience. These campaigns could benefit from geotargeting or more visual creatives (e.g., virtual tours) to increase clicks.
Facebook Ads performance & benchmarks by region (2025)
Here’s one thing beginners usually miss out on – region.
Performance of your Facebook Ads isn’t strictly dependent on creatives or budgets, it is also influenced by where your audience lives. Ad costs, engagement rates, and conversion patterns vary significantly by region, majorly due to internet behavior and local economies.
In this section, we will go through regional breakdown of core Meta Ads metrics, so you can:
Understand how top performers in each region are faring
Set more realistic performance expectations for your target markets
Identify cost-efficient geographies for scaling your campaigns
Facebook Ads benchmarks in US (United States) – 2025 vs 2024
Metric
2024 Value
2025 Value
YoY Trend (%)
Amount Spent (USD)
80,663.85
93,151.49
+15.48%
CPA (Cost per Acquisition)
911.30
2,272.71
+149.39%
CPC (Cost per Click)
1.40
1.67
+18.95%
CPM (Cost per 1,000 Impressions)
10.84
19.66
+81.46%
CTR (Click-through Rate)
2.734%
3.492%
+27.74%
Summary for Facebook Ads benchmarks in US
Amount Spent (USD): In 2025, the total amount spent on Facebook ads in the US is $93,151.49, showing a 15.48% increase from $80,663.85 in 2024.
Cost per Acquisition (CPA): The CPA rose by 149.39%, increasing from $911.30 in 2024 to $2,272.71 in 2025.
Cost per Click (CPC): The CPC saw an increase of 18.95%, moving from $1.40 in 2024 to $1.67 in 2025.
Cost per 1,000 Impressions (CPM): The CPM rose by 81.46%, increasing from $10.84 in 2024 to $19.66 in 2025.
Click-through Rate (CTR): The CTR improved by 27.74%, rising from 2.734% in 2024 to 3.492% in 2025.
Key insights for running Facebook Ads in US
Ad Spend Growth: Increased ad spend signals more competition for ad space. Focus on high-ROI campaigns to optimize budget allocation.
Rising CPA: The significant rise in CPA indicates a need for tighter audience targeting and optimized conversion paths to keep costs manageable.
Higher CPC: With CPC on the rise, consider refining your bidding strategy and creative optimization to reduce costs per click.
Increased CPM: The sharp rise in CPM suggests more expensive impressions; leverage advanced targeting to maximize ROI on ad spend.
CTR Improvement: Improved CTR shows ads are more engaging. Continue refining ad creatives to maintain this upward trend and drive more clicks efficiently.
Facebook Ads benchmarks in Europe – 2025 vs 2024
Metric
2024 Value
2025 Value
YoY Trend (%)
Amount Spent (USD)
66,337.54
57,331.54
-13.58%
CPA (Cost per Acquisition)
279.66
158.27
-43.41%
CPC (Cost per Click)
1.35
1.18
-12.79%
CPM (Cost per 1,000 Impressions)
4.99
4.90
-1.85%
Summary for Facebook Ads benchmarks in Europe
Amount Spent: In 2025, the total amount spent on Facebook ads in Europe is $57,331.54, reflecting a 13.58% decrease from $66,337.54 in 2024.
CPA: The Cost per Acquisition (CPA) has dropped by 43.41%, from $279.66 in 2024 to $158.27 in 2025.
CPC: The Cost per Click (CPC) has decreased by 12.79%, moving from $1.35 in 2024 to $1.18 in 2025.
CPM: The Cost per 1,000 Impressions (CPM) has slightly decreased by 1.85%, from $4.99 in 2024 to $4.90 in 2025.
Key insights for running Facebook Ads in Europe
Ad spend decline: Decrease in total ad spend suggests that Facebook Ads in Europe might be facing budget cuts or shifting priorities. This could be due to ad fatigue or better ROI on other platforms.
Significant CPA Reduction: The 43.41% drop in CPA is a positive trend, showing that advertisers are acquiring customers at a much lower cost. This suggests improvements in audience targeting and ad optimization.
Slight CPM Decrease: The 1.85% drop in CPM suggests marginally cheaper impressions in 2025. This could be due to reduced demand or a shift in Facebook’s ad inventory. Marketers should use this opportunity to increase reach while maintaining a focus on targeting high-converting segments to capitalize on lower costs.
Facebook Ads benchmarks in UAE (United Arab Emirates) – 2025 vs 2024
Metric
2024 Value
2025 Value
YoY Trend (%)
Amount Spent (USD)
20,299.86
33,657.75
+65.80%
CPA (Cost per Acquisition)
363.72
306.71
-15.68%
CPC (Cost per Click)
1.08
1.06
-1.86%
CPM (Cost per 1,000 Impressions)
2.96
7.47
+152.46%
Summary for Facebook Ads benchmarks in United Arab Emirates
In 2025, the total amount spent on Facebook ads in the UAE is $33,657.75, reflecting a 65.80% increase from $20,299.86 in 2024.
The Cost per Acquisition (CPA) has decreased by 15.68%, from $363.72 in 2024 to $306.71 in 2025.
The Cost per Click (CPC) has decreased by 1.86%, moving from $1.08 in 2024 to $1.06 in 2025.
The Cost per 1,000 Impressions (CPM) has increased significantly by 152.46%, from $2.96 in 2024 to $7.47 in 2025.
Key insights for running Facebook Ads in United Arab Emirates
Significant Increase in Ad Spend: The 65.80% rise in total ad spend signals a stronger push for Facebook Ads in the UAE. Advertisers should assess whether this increased investment aligns with campaign performance and identify high-ROI campaigns.
Lower CPA: The 15.68% reduction in CPA suggests that Facebook Ads are becoming more cost-effective for acquiring customers. This trend indicates that marketers are improving their targeting and ad performance.
CPC Decline: A 1.86% decrease in CPC means that advertisers are paying slightly less for each click. This could be due to more precise audience targeting and better ad relevance.
Explosive Rise in CPM: The 152.46% increase in CPM is substantial, and marketers should take note of this significant cost rise for impressions. This could be due to increased competition or higher demand for ad placements. Advertisers should refine targeting to ensure that increased CPM doesn’t negatively affect the overall return on investment.
Facebook Ads benchmarks in the UK (United Kingdom) – 2025 vs 2024
Metric
2024 Value
2025 Value
YoY Trend (%)
Amount Spent (USD)
159,893.17
129,471.68
-19.03%
CPA (Cost per Acquisition)
1,127.47
533.76
-52.66%
CPC (Cost per Click)
2.68
2.04
-23.78%
CPM (Cost per 1,000 Impressions)
14.44
23.79
+64.72%
CPL (Cost per Lead)
5.71
171.92
+2911.83%
Summary for Facebook Ads benchmarks in United Kingdom
Amount Spent: The total amount spent on Facebook ads in the UK is $129,471.68 in 2025, reflecting a 19.03% decrease from $159,893.17 in 2024.
CPA: The Cost per Acquisition (CPA) has decreased by 52.66%, from $1,127.47 in 2024 to $533.76 in 2025.
CPC: The Cost per Click (CPC) has decreased by 23.78%, moving from $2.68 in 2024 to $2.04 in 2025.
CPM: The Cost per 1,000 Impressions (CPM) has increased significantly by 64.72%, from $14.44 in 2024 to $23.79 in 2025.
CPL: The Cost per Lead (CPL) has risen by 2911.83%, from $5.71 in 2024 to $171.92 in 2025.
Key insights for running Facebook Ads in United Kingdom
Decreased Ad Spend: The 19.03% decrease in ad spend reflects a scaling back of investments. Marketers should investigate which campaigns underperformed to adjust their budget allocation accordingly.
Lower CPA: The 52.66% reduction in CPA indicates more efficient customer acquisition. This could be the result of better-targeted ads or improved ad performance.
CPC Decline: The 23.78% drop in CPC means advertisers are paying less for each click. Optimizing targeting and ad creatives could have contributed to this improvement.
CPM Increase: The 64.72% increase in CPM signals rising costs for impressions, likely due to increased competition. Marketers should focus on refining their targeting to avoid overspending on impressions.
Explosive CPL Increase: The 2911.83% rise in CPL requires further investigation. This extreme change could signal inefficiencies in lead generation or target misalignment.
Facebook Ads benchmarks in Australia – 2025 vs 2024
Metric
2024 Value
2025 Value
YoY Trend (%)
Amount Spent (USD)
44,731.91
35,346.67
-20.98%
CPA (Cost per Acquisition)
501.58
384.29
-23.44%
CPC (Cost per Click)
1.79
1.47
-17.88%
CPM (Cost per 1,000 Impressions)
21.86
15.65
-28.31%
CPL (Cost per Lead)
5.25
6.94
+32.19%
Summary for Facebook Ads benchmarks in Australia
Amount Spent: In 2025, the total amount spent on Facebook ads in Australia is $35,346.67, showing a 20.98% decrease from $44,731.91 in 2024.
CPA: The Cost per Acquisition (CPA) has decreased by 23.44%, from $501.58 in 2024 to $384.29 in 2025.
CPC: The Cost per Click (CPC) has decreased by 17.88%, moving from $1.79 in 2024 to $1.47 in 2025.
CPM: The Cost per 1,000 Impressions (CPM) has decreased by 28.31%, from $21.86 in 2024 to $15.65 in 2025.
CPL: The Cost per Lead (CPL) has increased by 32.19%, from $5.25 in 2024 to $6.94 in 2025.
Key insights for running Facebook Ads in Australia
Decreased Ad Spend: The 20.98% decrease in ad spend indicates a scaling back of campaigns in Australia. Marketers should review campaign performance and optimize budget distribution.
Lower CPA: The 23.44% reduction in CPA suggests better efficiency in customer acquisition, reflecting improvements in targeting and ad optimization.
CPC Decline: The 17.88% drop in CPC is a positive trend, signaling lower costs for each click. This suggests that ads are becoming more engaging and relevant.
Reduced CPM: The 28.31% decrease in CPM indicates lower costs for impressions. This can be leveraged by expanding reach, but careful targeting is essential to avoid inefficient spend.
Higher CPL: The 32.19% increase in CPL should be closely monitored, as higher costs for leads may impact profitability.
Facebook Ad benchmarks in Canada – 2025 vs 2024
Metric
2024 Value
2025 Value
YoY Trend (%)
Amount Spent (USD)
83,648.07
77,174.88
-7.78%
CPA (Cost per Acquisition)
476.67
324.92
-31.85%
CPC (Cost per Click)
3.33
2.97
-10.82%
CPM (Cost per 1,000 Impressions)
9.79
7.15
-26.92%
CPL (Cost per Lead)
3.41
5.81
+70.47%
Summary for Facebook Ads benchmarks in Canada
Amount Spent: In 2025, the total amount spent on Facebook ads in Canada is $77,174.88, reflecting a 7.78% decrease from $83,648.07 in 2024.
CPA: The Cost per Acquisition (CPA) has decreased by 31.85%, from $476.67 in 2024 to $324.92 in 2025.
CPC: The Cost per Click (CPC) has decreased by 10.82%, moving from $3.33 in 2024 to $2.97 in 2025.
CPM: The Cost per 1,000 Impressions (CPM) has decreased by 26.92%, from $9.79 in 2024 to $7.15 in 2025.
CPL: The Cost per Lead (CPL) has increased by 70.47%, from $3.41 in 2024 to $5.81 in 2025.
Key insights for running Facebook Ads in Canada
Decreased Ad Spend: The 7.78% decrease in ad spend suggests a possible reduction in overall budget for Facebook Ads. Marketers should assess campaign performance to ensure optimal budget allocation.
Lower CPA: The 31.85% drop in CPA reflects improved efficiency in acquiring customers. Optimized targeting and creatives likely contributed to this improvement.
CPC Decline: The 10.82% reduction in CPC is a positive trend, showing that advertisers are paying less for clicks, indicating improved engagement or bidding strategies.
Lower CPM: The 26.92% decrease in CPM shows reduced costs for impressions. Advertisers should leverage this opportunity to expand reach without increasing costs.
Higher CPL: The 70.47% rise in CPL should be addressed, as it may indicate inefficiencies in the lead generation process.
Facebook Ads Benchmarks in Egypt – 2024 vs 2025
Metric
2024 Value
2025 Value
YoY Trend (%)
Amount Spent (USD)
17,112.10
22,758.12
+32.97%
CPA (Cost per Acquisition)
9.38
5.12
-45.06%
CPC (Cost per Click)
0.26
0.34
+30.77%
CPM (Cost per 1,000 Impressions)
1.58
1.94
+22.78%
CPL (Cost per Lead)
3.93
6.21
+57.91%
Summary for Facebook Ads benchmarks in Egypt
Amount Spent: The total amount spent on Facebook ads in Egypt in 2025 is $22,758.12, reflecting a 32.97% increase from $17,112.10 in 2024.
CPA: The Cost per Acquisition (CPA) has decreased by 45.06%, from $9.38 in 2024 to $5.12 in 2025.
CPC: The Cost per Click (CPC) has increased by 30.77%, moving from $0.26 in 2024 to $0.34 in 2025.
CPM: The Cost per 1,000 Impressions (CPM) has increased by 22.78%, from $1.58 in 2024 to $1.94 in 2025.
CPL: The Cost per Lead (CPL) has increased by 57.91%, from $3.93 in 2024 to $6.21 in 2025.
Key insights for running Facebook Ads in Egypt
Increased Ad Spend: The 32.97% increase in ad spend indicates higher investments in Facebook Ads in Egypt. Advertisers should monitor whether this increased spend is driving desired results.
Lower CPA: The 45.06% drop in CPA is an excellent outcome, suggesting improved efficiency in customer acquisition.
CPC Increase: The 30.77% increase in CPC suggests rising competition for clicks, meaning advertisers must refine their targeting and creative strategies.
CPM Rise: The 22.78% increase in CPM indicates that impressions are becoming more expensive. Marketers should optimize audience targeting to mitigate this cost increase.
Higher CPL: The 57.91% increase in CPL suggests a need for investigation into lead generation strategies, as the cost for leads has risen significantly.
Facebook Ads Benchmarks for South Asia and Africa 2025
Region
Metric
2025 Value
South Asia
Amount Spent (USD)
42,100.67
CPA (Cost per Acquisition)
5.21
CPC (Cost per Click)
0.41
CPM (Cost per 1,000 Impressions)
2.51
CPL (Cost per Lead)
2.98
CPC (Cost per Purchase)
1.18
CTR (Click-through Rate)
3.71
Southeast Asia
Amount Spent (USD)
57,248.92
CPA (Cost per Acquisition)
11.79
CPC (Cost per Click)
0.56
CPM (Cost per 1,000 Impressions)
5.93
CPL (Cost per Lead)
3.72
CPC (Cost per Purchase)
0.94
CTR (Click-through Rate)
3.05
Africa
Amount Spent (USD)
22,569.87
CPA (Cost per Acquisition)
6.41
CPC (Cost per Click)
0.24
CPM (Cost per 1,000 Impressions)
1.76
CPL (Cost per Lead)
3.50
CPC (Cost per Purchase)
1.20
CTR (Click-through Rate)
3.12
Key insights and strategies for running Facebook Ads in South Asia and Africa
Cost Efficiency: South Asia and Africa offer the best opportunities for cost-effective campaigns, especially when targeting a large audience or focusing on driving clicks. Advertisers should prioritize high-volume campaigns with low-budget allocations in these regions.
Targeted Campaigns in Southeast Asia: While Southeast Asia has a higher CPM and CPC, the region still offers good returns in terms of cost per acquisition and CTR. Advertisers should refine their targeting and focus on high-value segments to maximize ROI.
Focus on Lead Generation: All regions offer affordable CPL relative to global standards, but South Asia presents the lowest CPL, making it an excellent region for lead generation. Marketers should optimize their lead-gen campaigns with tailored creatives for each region.
Ad Creative Optimization: Despite the variations in CPM and CPC, all regions show strong engagement (CTR), particularly in South Asia and Africa. Marketers should test and optimize ad creatives to further boost performance and ensure relevance across diverse markets.
Try AI to Analyze your Meta Ads ✨
Save hours. Let AI show you where your ads can do better ✅️
If your Facebook ad performance isn’t matching the benchmarks, it is time to recheck your organic and paid social media strategy.
Here are a few ways to improve key metrics, including conversion rate for Facebook ads:
(PS: Checking conversion rate for Facebook ads is now easy with Vaizle AI. Instead of looking at Ads Manager dashboard, you can simply ask a question in plain English language, and get the required answer. Additionally, you can also fetch conversion rates (along with other metrics) for different campaigns, benchmark them against past performance, export to an Excel, and a lot more.)
Writing persuasive & high-impact ads
If the messaging in your ads isn’t clear enough for the audience, you won’t notice any engagement or clicks whatsoever.
As such, ensure that your ad includes all three fields:
Headline
Description
Primary Text
Also, enable the ‘optimize text per person’ option so that Facebook can switch up the ad components to improve performance.
Installing the Meta-pixel
Also known as the Facebook retargeting pixel, Meta pixel is a code snippet that can help you:
Meta also lets you create A/B tests to identify the issue with the ad by comparing different creative assets, ad placements, and audiences.
While running the ad, see whether the A or B option performs better and optimize the rest of your campaigns accordingly.
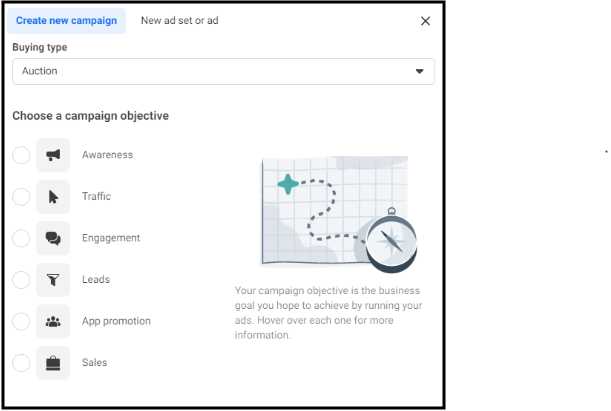
How to Use Facebook Ads to Drive Traffic & Leads?
Marketers advertise on Facebook with different objectives in mind. Some want to spread brand awareness, while others might to generate sales and hike their ROI.
Facebook lets you select an objective before setting up a new campaign, including Awareness, Traffic, Engagement, Leads, App promotion, and Sales.
Now, if you want to improve Facebook ads traffic and leads, you need to:
Define the target audience: Meta ads offer multiple demographic targeting options like age, gender, region, language, educational qualification, job titles, relationship status, home ownership, and more. Toggle with the audience settings to laser focus on the consumer niche that is more likely to make a purchase.
Retarget website visitors: You have a higher chance of driving sales when all the users who visited your website in the past are retargeted again with exclusive offers and messages. As such, you can add the website link to your Facebook ads and build a ‘retargeting pool.’
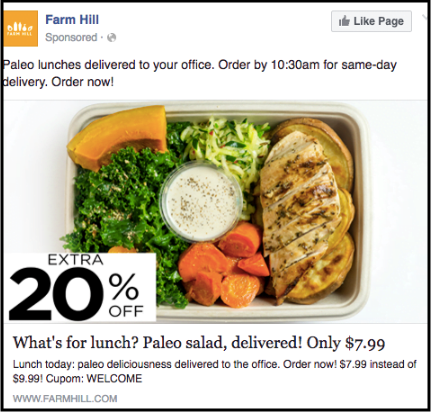
Show real people in your ads: You don’t need to write ad copies that sound way too sophisticated, or AI-generated. Instead, focus on keeping the content simple and use real people in your ad images or videos to help the user feel more connected to your brand.
How to Improve Facebook Ads CTR & Conversion Rate?
Facebook ads CTR and Conversion Rate are related in many ways. You can’t see an improvement in the latter without the former.
So, how do you hike up the CTR? Let’s have a look at some of the tried and tested ways to interest your audience:
Keep the ad copy short
Generally, it has been noticed that the engagement rate decreases as the length of the text increases. Ensure to keep the ad messaging straightforward and easy to understand.
Ask intriguing questions
Your headline should be the ad showstopper and immediately capture attention. Asking questions might ignite curiosity in the reader and motivate them to click or engage with the ad.
Use action verbs
For improved CTR, you need to motivate the user to take action. Therefore, use the right action verbs that will encourage the potential consumer to stop scrolling and do what you want them to!
Add relevant emojis
To add visual emphasis and a more friendly touch to your ads, you can use relevant emojis. However, ensure that you aren’t misusing them, which can in turn lead to distraction from the actual cause.
Conclusion
Getting your Facebook ads game strong can be pretty challenging – especially if you are new to social media marketing. Hopefully, the tips and strategies listed in this blog will help you achieve your goals and reach the Facebook ads benchmarks.
Vaizle makes it easy for you to track Facebook ad performance, identify any voids in your marketing strategy, and explore latest insights to optimize campaigns accordingly!
Best part? You can now even talk to your Facebook Ads data and get all metrics within seconds. It is as simple as asking a question. For example: “What is my ROAS for past 3 days?”
Mamta is an SEO Analyst with 4 years of experience. Currently, she is spending her time on content roadmapping to drive organic growth and engagement for SaaS businesses. Mamta is also an avid cinephile who spends her spare time watching latest action and sci-fi flicks from around the world.