


Running a marketing agency seems exciting till you’re burdened with the task of creating a social media report. But hey — no matter how tedious report creation might seem at first, its importance in the grand scheme of digital success is undeniable.
After all, you’ve put in a lot of effort to get great results for your clients, and social media reports can help summarize the whole journey for a performance review or your team’s self-evaluation.
And if you’re new to the world of social media reporting, you’ve landed at the right place. In this blog, I will help you figure out what a social media analytics report should include and how you can create one with Vaizle (without spending hours on it).
A social media report is a document detailing the performance of your social media channels w.r.t. different key metrics over a period (weekly, quarterly, monthly, and so on). Ideally, a social media report should be clear, precise, and easy to understand for the reader.
Depending on your goals, the social media metrics mentioned in the report will change. For example: if you want to analyze content’s impact, listed key performance indicators (KPIs) will be likes, shares, comments, or time spent on the content. Similarly, if you want to measure campaign ROI, a report will detail conversion rate, cost per click (CPC), and return on ad spend (ROAS).
All the data points mentioned in a social media analytics report will help you identify data patterns, measure the success of campaigns, and spot any gaps in the ongoing social media strategy.
For example: if your brand’s account is suddenly getting more attention from women aged 25-36, a report will help you spot that instantly!
TL; DR
Remember the report cards you’d get from your school? A social media report is something just like that!
The only difference is that instead of your academic performance, it highlights your social media campaign’s effectiveness and other crucial insights! (and maybe a bit less daunting at times)
Why go to such extents to find social media reports when you can easily access the same data on your dashboard?
If you’re also wondering the same thing, here are a few key benefits that will convince you to start social media reporting for your brand or agency:

To summarize the blog so far, we can say that a social media report is a collection of data and statistics.
But out of hundreds of available metrics, which ones should you cherry-pick for your report? The right answer to this question will depend on your client’s overall goals and preferences.
Also, it is recommended to design the overall report by considering your target audience.
Make sure you know who will be reading your report (or attending your presentation) and include information relevant to them. Using a well-designed presentation template can also help you organize and present your insights more clearly. You can also elevate your reporting workflow by turning insights into polished slides using an AI presentation maker, making it easier to present social media results clearly and professionally to clients or stakeholders
After all, a marketing team may want to see different data than a finance team or company executives. Similarly, when analyzing financial performance, insights into secured loans can help assess long-term stability and risk management.
Starting your report with a basic introduction can help put the data you’re presenting into context. Doing so will help remind your clients what you’re doing and how it can help you in the long run.
Discuss their social media marketing objectives and KPIs, as well as the strategies you’re employing to attain them.
A good social media report should be concise enough to keep clients interested while still containing all relevant facts.
Without knowing the standard industry standards, you can’t know how many followers to aim for. Similarly, you can’t ensure that your clients are getting a good return on their paid ad expenditure without knowing the average ROI of a particular niche.
In short — you won’t be able to properly understand the data unless you look at the bigger picture of what’s happening on social media. That’s where competitive analysis comes in.
Competitive benchmarking is a method of putting your clients’ social media performance into context and assisting them in understanding how they perform to their competitors.
Interested in reading more about competitive analysis? Check out: How to do Social Media Audit: Competitive Analysis
Needless to say, your social media analytics report must include all data points that are currently relevant for your campaign (or might be in the future).
You should include all the indicators that are most related to your KPIs, as well as anything notable or particularly impressive.
For example: if one of your goals is to boost Facebook views and follower count, add all indicators related to it.
But occasionally, you can also integrate other intriguing details — like an Instagram post going viral or a sudden spike in Twitter followers.
If you scroll back to the top, you’ll recall that an ideal social media report should be easily understandable for a reader.
Broadly speaking, your clients are likely to be less data-savvy than you. As such, they may require additional help in deciphering some information.
That’s where the metrics overview comes into the picture. It can help your clients come back to the report and know what’s listed in it without putting in a lot of effort.
A social media report should always answer the question: Which channel are you generating the most revenue from?
Breaking down data by channel allows you to observe how each channel affects your overall business growth.
As such, you can compile metrics for each channel so that your clients may see how they’re performing in-depth. Based on this information, you may want to target a particular platform moving forward.
It will also assist in determining which social platforms are the most and least effective for a particular niche.
Let’s be honest — textual data is incredibly boring to read and comprehend. No one wants to go through a row of spreadsheet blocks to spot the ongoing data patterns. That’s why you need to make your social media reports more appealing and display complex data in an engaging manner. One way to do so is by adding graphs, charts, and images to the report.
That’s why you need to make your social media reports more appealing and display complex data in an engaging manner. One way to do so is by adding graphs, charts, and images to the report.
Also, the report should include your brand logo to maintain an overall professional image and transparency with the client.
Your social media report can be as simple or intricate as you want. It can just be an Excel sheet with the latest data insights or a visually interactive report with all the data metrics and graphs. (PS – as a social media marketer, I highly recommend the latter one!)
If you want to go with a simple analytics report, simply pick the metrics and enter them into any blank sheet and you’re good to go. But if you want to offer your clients a well-organized and visually appealing report, White Labeled Report by Vaizle is going to save you a lot of time.
Let’s see how you can start social media reporting with Vaizle.
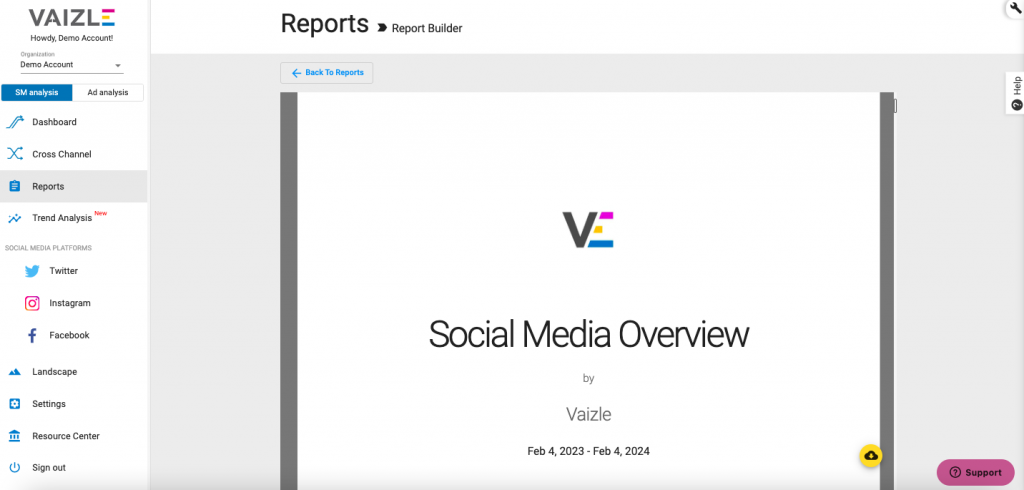
Step 1: Log in to your Vaizle dashboard and head to the ‘Reports’ tab. Click on ‘Competitive SM Analysis’ and the tool will now redirect you to the Report Builder.
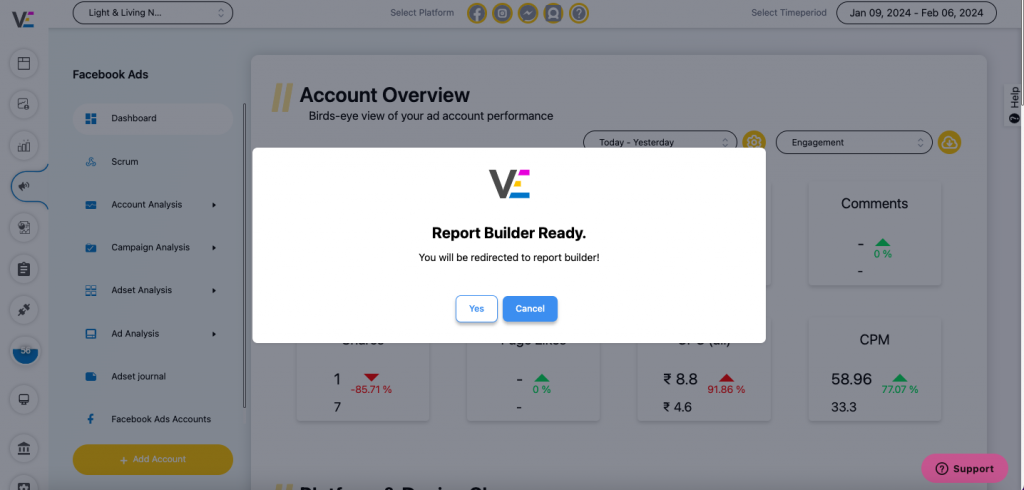
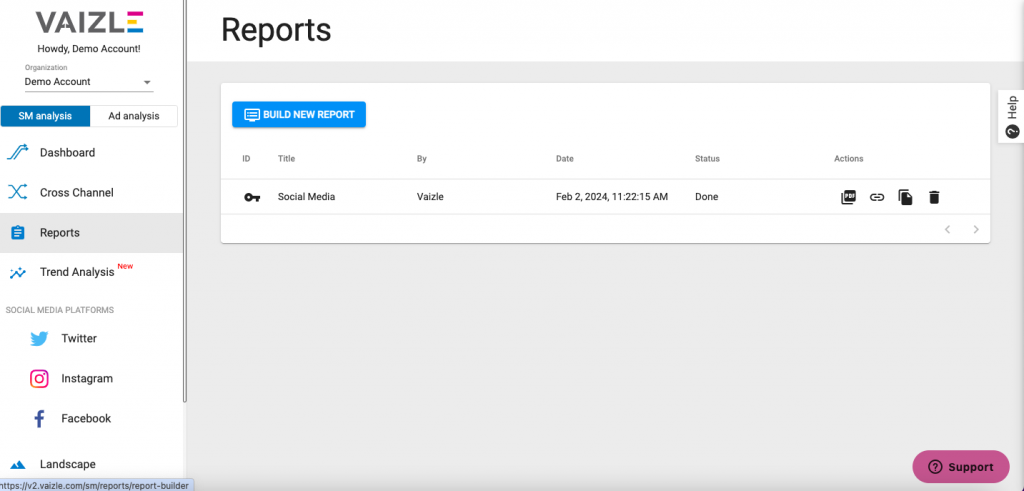
Step 2: Click on ‘Build New Report’ to start creating a social media analytics report.
Step 3: Now, customize the report as per the available features.
Here’s what you can do with the Vaizle report generator:
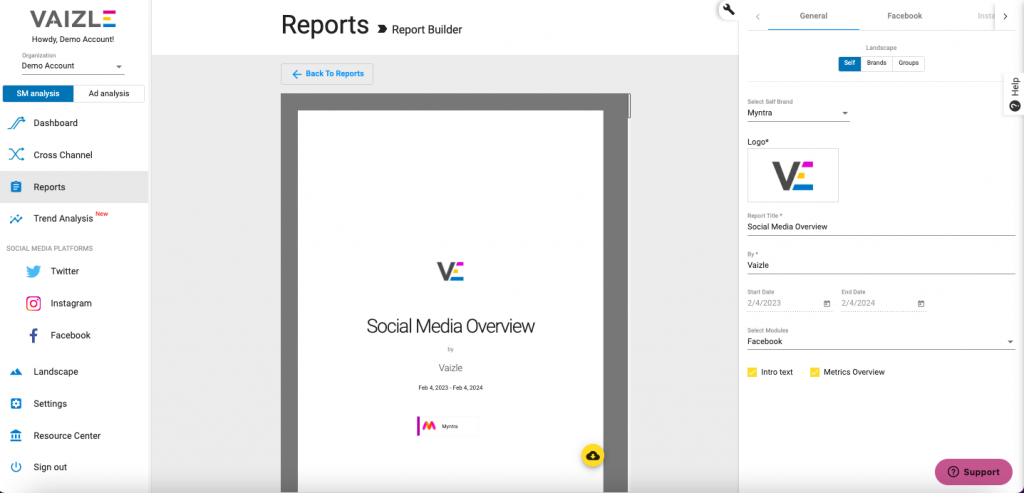
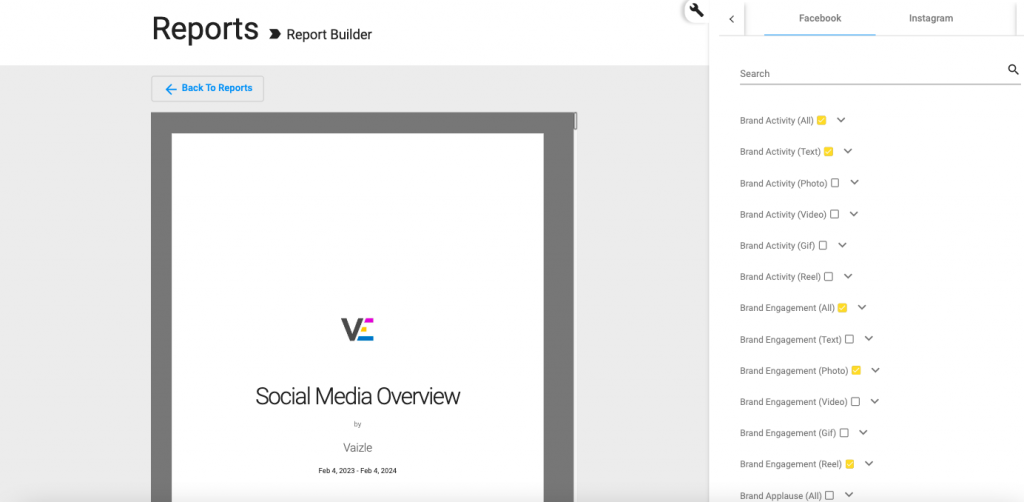
Step 4: Pick the metrics you want to add.
Once the basic template of your social media report is ready, select the metrics you want to mention. Vaizle has listed all the available metrics for Facebook, and Instagram.
Step 5: Once the report is ready, click on the download icon at the bottom.
Don’t want to download the report on your device? No issues!
Vaizle also lets you share the live link with your team or clients for easy collaboration.
But that’s not all!
You can also duplicate your existing report to create a new one without having to set the entire template again.
Pretty cool, right? There’s a lot more to explore.
Social media reporting is necessary to evaluate the extent of your social reach and track KPIs. A report will help your team and clients know exactly what you’ve achieved so far and make data-driven decisions regarding what to focus on next.
Hopefully, this guide will help you create insightful and data-driven social media reports to streamline your marketing efforts.
And if you still haven’t found a reliable tool for analyzing your ad account’s data, check out free ad analytics tools by Vaizle: Facebook ads analysis and Google ad analysis.
Arushi is a proficient SEO and ASO specialist with a 5-year track record working for B2B and B2C organizations. Currently, she is heading SEO strategy for Vaizle and helping businesses improve their online presence. A mountain girl at heart, she likes to recharge her creative abilities by taking long walks and listening to podcasts.
Copyright @VAIZLE 2026