


Social media marketing is as much about numbers as it’s about content, message, and aesthetic. In context of social media, those numbers are called social media key performance indicators or KPIs.
So when your client or your boss asks you, “Hey John, how are we doing on social media?”
“Pretty good” will not be an apt response.
You need to back it up with numbers. That is, social media KPIs.
While all social media channels have some common performance indicators (for example, number of posts per week), the social media marketing KPIs are also platform specific. For example, while Number of Shares is specific to Facebook, Number of Retweets is what people use for Twitter, even though the nature of both social media KPIs is fundamentally same.
To organize it and make sense of social media performance, we wanted to throw a light on social media KPIs.
For more clarity and ease, you can segregate social media KPIs in three parts.
In this blog post, we take a look at each category of social KPIs and understand these key performance indicators with examples.
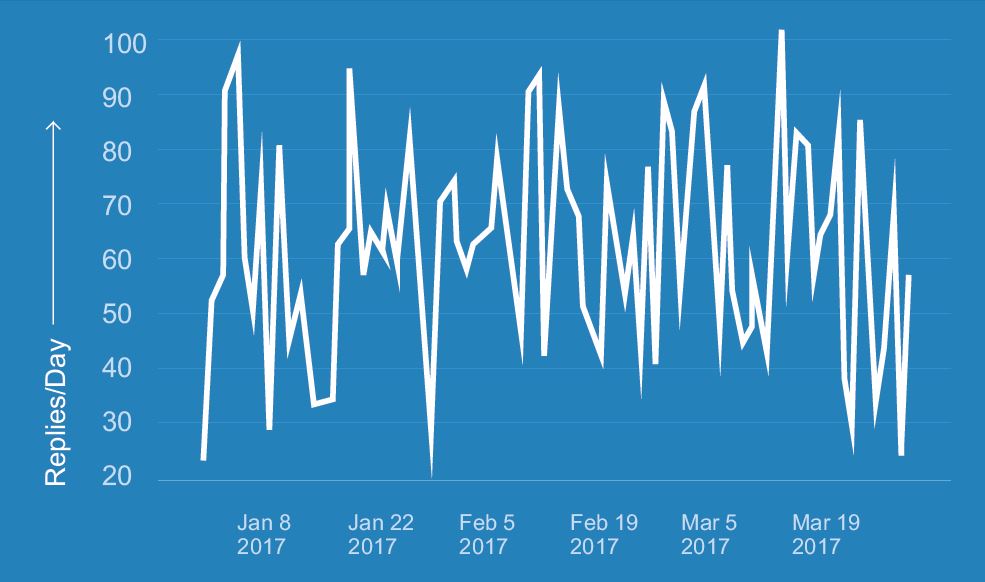
I would introduce this as one of the most ignored social media parameter. While people are talking about total engagement, especially in organic terms, it is equally important to understand its relation with brand activity. It’s always wise to monitor your own activity on social media. But most importantly, it will help you calculate your consistency.
It’s a measure of number of posts you shared on social media in a given period of time. The time frame is usually used is day, week, or month.
It can be calculated as average number of posts shared in a day in a given period of time. It can be calculated weekly, monthly or early.
Average Brand activity = Total number of posts in a day, week, or month / Time period
You can choose any one depending upon the nature of your business and how important social media in your context.
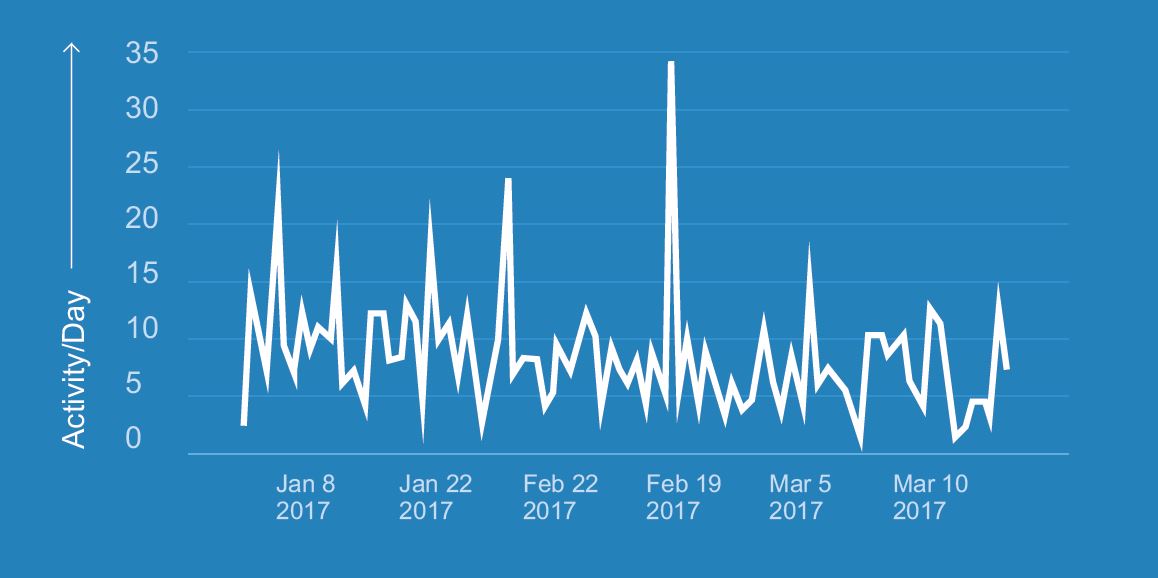
The best way to track this KPI is by looking at the timeline of brand activity graph. By calculating the standard deviation, you can calculate your consistency across a period.
Engagement is a measure of number of times someone interacted with your social media posts. It is calculated as a sum of likes, shares, comments, and clicks on your posts.
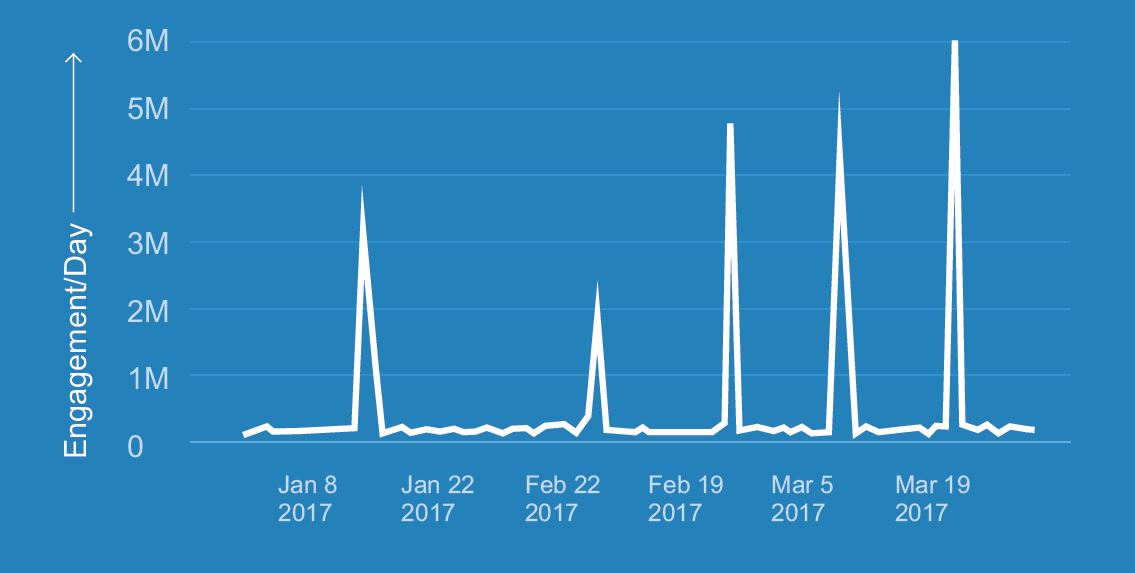
Social media engagement = Likes + Comments + Shares + Link Clicks + (3-second Video Views, if the post is a video)
This is probably the parameter your boss or your agency will be concerned with the most. And not only engagement in general, they would also want to see a breakdown of engagement into likes, comments, and shares.
This is the most talked about and most looked at parameter among social media marketers. But it has so many facets. However, there is still a lot of consensus on how one looks at social media here.
That’s why social media engagement further divided into three major parts.
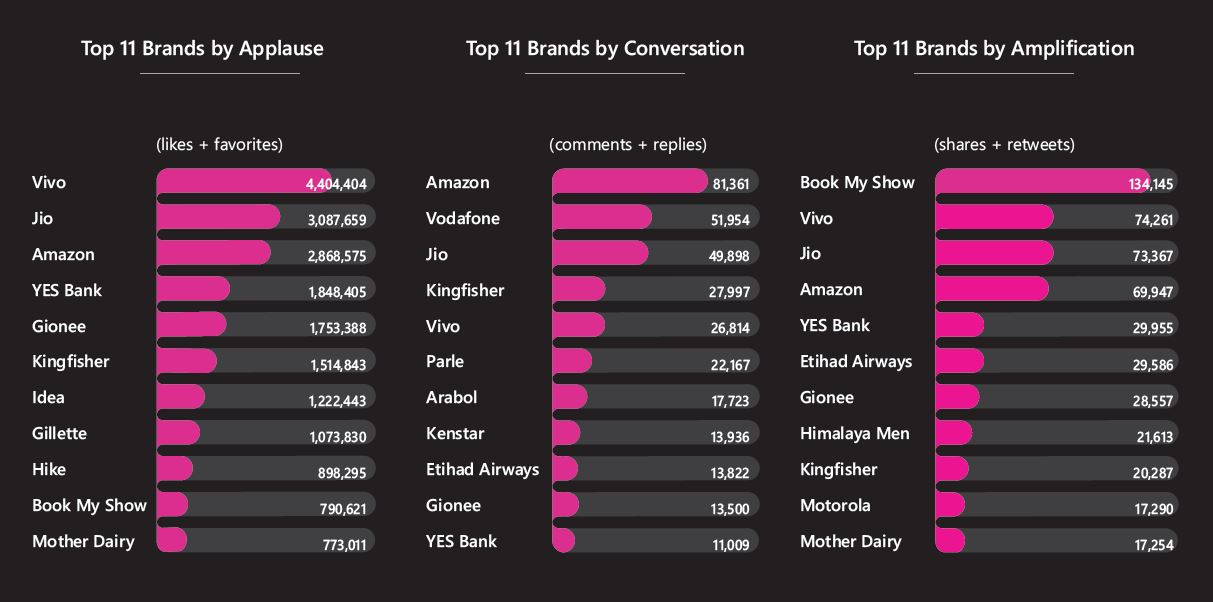
Applause is a measure of how many times your brand activity was applauded on social media. It is calculated as a sum of all the likes on your posts.
The number of likes on your post and your page was something to be proud about. However, over the years, likes have tuned out to be a vanity metric for social media marketers.
In my view, it depends on your marketing objective. Not all posts are meant to generate clicks or turn prospects into customers. Likes are also important for business as long as you know how to use them.
Conversation is the measure of how many times someone engaged with your brand activity by commenting on it.
It is also a better parameter to judge your content’s performance when you want to initiate dialogue with your social audience. Naturally, this is one of the most popular social media KPI for brands.
Recently, the algorithm changes by Facebook, LinkedIn, and Twitter pushes content further if they are generating meaningful conversations. It’s as good as sharing a content. The general rule is that the more people talk about your post by commenting on it, the more will be its organic reach.
Conversation has also one more aspect: how many times did YOU respond to your own audience? Also, known as brand response.
Brand response is the measure of the number of times you responded to the comments and people via your social media channels.
While people are commenting on your posts, it’s always a good practice to reply to them when it makes sense. Many brands use Twitter as a customer service platform.
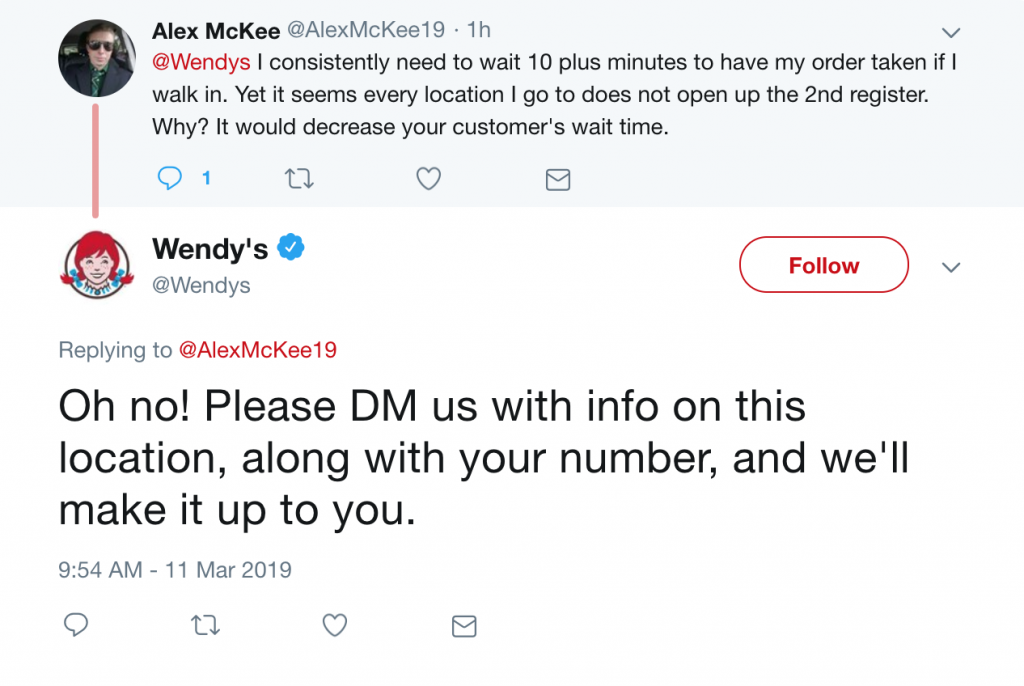
Brand responses is the best social media KPI to measure the proactiveness of a brand to become part of conversations.
This parameter was earlier important on Twitter only because the number of people who responded to brands were more active on Twitter. However, it has become more pervasive across all social channels. You have to respond to your customer queries.
Even on Facebook Messenger and Instagram brands are actively responding to customer’s words.
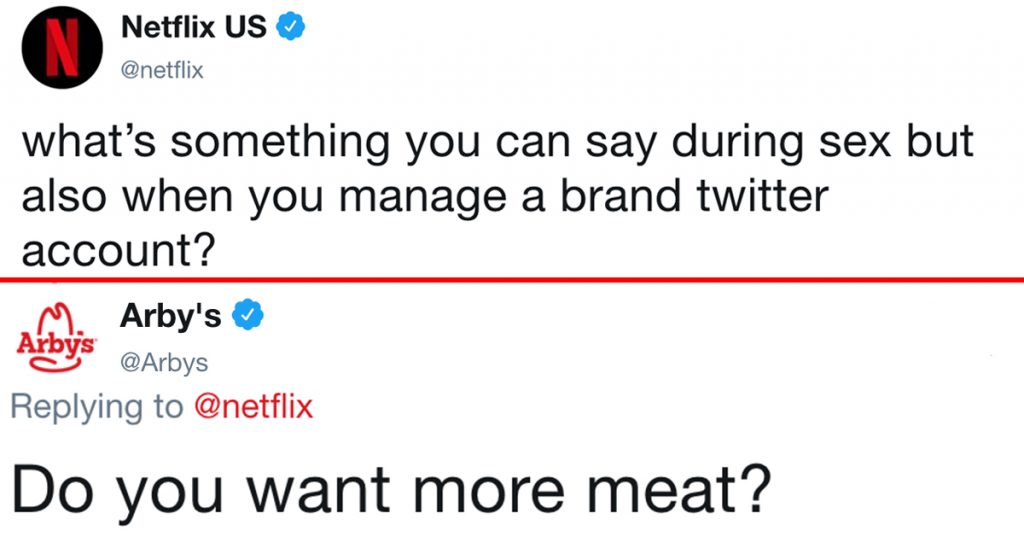
In the last few years, brands have even started to initiate conversations with people and other brand themselves.
Amplification is the measure of number of times your posts were shared on social media channels.
According to many marketers, there’s only one parameter which decides whether your content will go viral or not. And that’s share-ability.
If your strategy includes creating viral content, you need to focus on amplification.
This can give an enormous boost to your social media efforts. There are number of brands who have built amazing traction without spending a dime on ads because their content was so engaging and shareable, it was made viral by your social media audience.
Engagement rate is a measure of how engaging your content is among your followers and viewers. If you’re a social media marketer, this is one social media KPI that you always need to keep an eye on.
Engagement rate is calculated as a percentage of how many engagement did a social media post get out of your total followers.
Engagement rate = (Total Engagement/Total Followers) x 100%
This can further be divided into sub parts like applause rate, conversation rate, and amplification rate if you change the numerator in the above equation.
This also gives way to another key parameter known as virality rate.
Virality rate is calculated as a percentage of the number of people who shared your post relative to the number of people who ACTUALLY saw it.
Again this parameter helps you judge the quality of your content. And the difference here is that instead of looking at the total followers, we’re looking at impressions of the individual posts.
Another parameter which is used in context of engagement is called engagement per activity. If you’re more concerned with your engagement number growing rather than the rate of engagement, this is the social KPI you need to track.
Engagement per activity is the measure of number of engagements (applause, conversation, amplification) you received per post in a specific period of time.
You can track this parameter week-over-week to see the growth of your social media page.
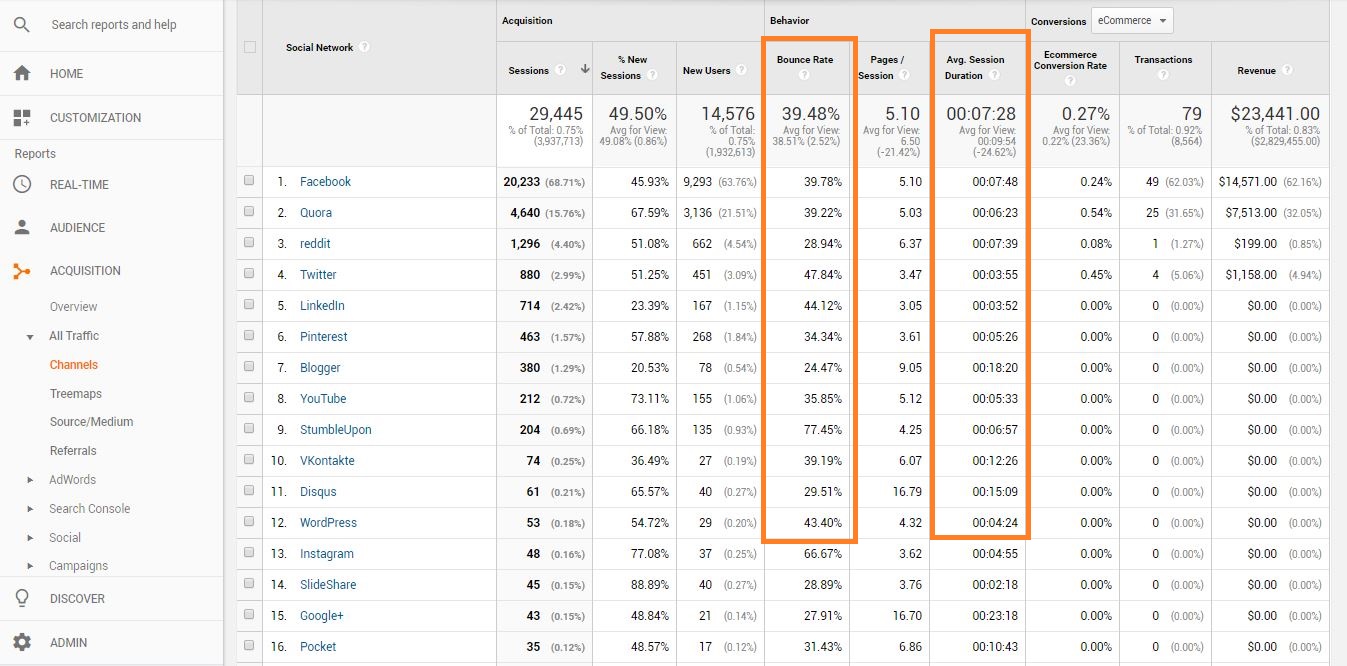
Although it can be tracked in many ways, the simplest is by tracking bounce rate and average session duration by the social media traffic. You can check this data in Google Analytics or any other web analytics tool you use for your organization.
Bounce rate is the measure of number of people who left your website after engaging with it only for a few seconds or by visiting only a single page.
This helps you to understand if your social media audience is right for you.
Average Session Duration (from social traffic) is the measure of average time spent by people on your website.
This helps to understand whether the traffic you’re attracting from social media is right or not.
A part of social media listening, brand mentions is a social KPI that try to understand how many people are talking about your brand on social media.
People will even talk about you on a platform where you’re not. That’s why it also becomes important to track brand mentions across social media.
Brand mentions is the measure of number of times someone on social media mentioned your brand name by tagging you. This excludes all the mentions where the brand is not tagged
You or your social media managers always need to be on their toes for brand mentions. And only when you track the number of mentions will you know how many people actually are talking about you.
Social Media RoI is not always calculated in dollars. In fact, if you’re always doing that, you’re probably not doing social media marketing right.
There are other KPIs you should always be tracking to understand how and how much social media can contribute to your overall marketing. And it starts with total reach and impression.
Reach is the measure of number of people who saw your social media brand activity.
Impression is the measure of the total number of times your social media brand activity was seen.
So if your post reach is, let’s say, 1,000 and received 1,500 impressions, it means your post was seen by 1,000 people who saw your post 1,500 times.
Here are three major other social media KPIs that you need to track.
These three social media KPIs ultimately link your social media efforts to actual business impact.
Even if your business focuses only on traffic (let’s say you’re a news website), you can calculate the money saved by checking out how much you’re spending to attract same traffic from other channels.
Social traffic is the measure of number of times your social media activity sent a person to your website.
Social leads is the measure of number of leads that were generated from your social media efforts.
Social conversion rate is the percentage of social media traffic that turned into a customer.
You can represent it in two forms to make this data more valuable. Social media leads to conversion ratio and social media traffic to conversion ratio.
You can then also breakdown the data and check conversions for each social media channel. This will help you understand whether Facebook is giving you more customers or Twitter.
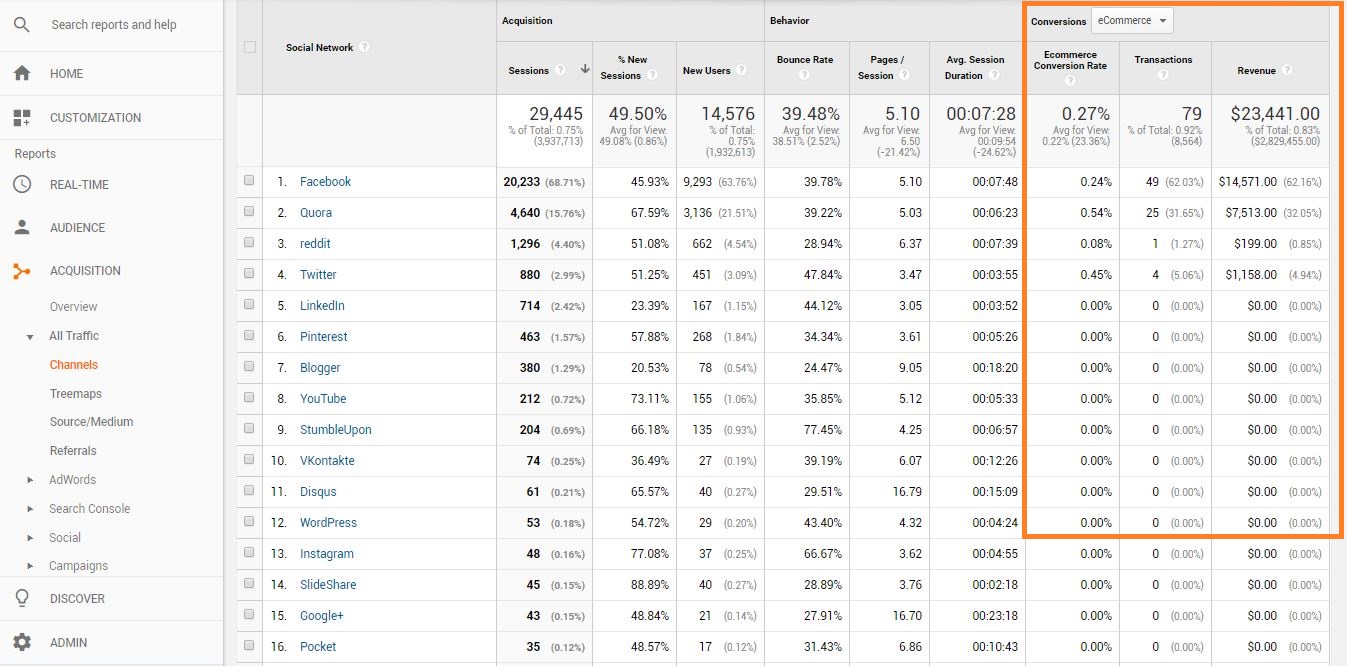
If you have ecommerce conversion goals setup in Google Analytics, you can check this data directly in Google Analytics.
Another way to check how social media is helping you in generating revenue is by checking Assisted Conversions in Google Analytics.
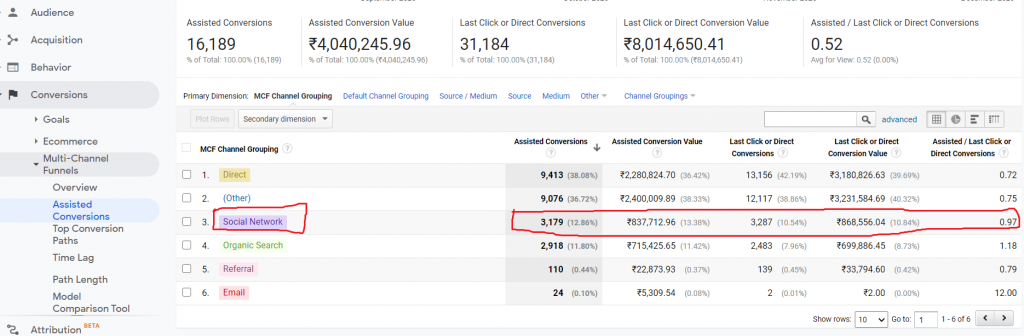
While checking this report in google analytics, some of the conversions will will also be attributed in the default channel groupings to ads that you may be running on Facebook and Instagram.
To ensure that your social media organic data and social media paid ads data are separate, either try to create custom channel grouping or add UTMs in URLs when posting on social media.
For more details, read our blog post on how to track social media performance on google analytics
So there you have it: all the social media metrics explained.
Of course there are many more metrics. As I already said it varies from platforms-to-platforms. And I am sure I haven’t discussed all of them: check-ins, ratings, page reviews, and there’s so much more to social media.
Understanding these parameters is important to understand how your social media is contributing to your business. By jumbling and understanding which KPI is most relevant for your objective, you can track your social media performance better.

Siddharth built two bootstrapped companies from the ground up: Vaizle and XOR Labs. He’s personally managed over Rs 100cr in ad budget across eCommerce, D2C, ed-tech, and health-tech segments. Apart from being a full-time marketer, he loves taking on the challenges of finance and operations. When not staring at his laptop, you’ll find him reading books or playing football on weekends.
Copyright @VAIZLE 2024