If you manage more than one Facebook ad account, you know how quickly it gets messy. You check one account, move to the next, and by the time you’re done, you still don’t have a clear picture of what is happening across all of them.
You may be doing this because one brand has separate accounts for different regions. Or because your agency manages multiple clients. Maybe you rolled out the same change across a few accounts and now want to see whether it worked.
Either way, checking the accounts one by one is not the best way to answer these questions. You need to bring the data together first and then compare it in the right context.
The good news is that Meta lets you do this through cross-account reporting. You can select multiple ad accounts and review their performance in one report.
But creating one report and analyzing it correctly are two different things. This guide covers both: how to set up cross-account reporting in Meta and how to compare accounts without letting different goals, currencies, attribution settings, or data volumes distort the result.
What does analyzing multiple Facebook ad accounts actually mean?
At its simplest, cross-account analysis means reviewing the performance of two or more Facebook ad accounts using the same reporting period and set of metrics.
But not everyone is combining accounts for the same reason. Before creating a report, you need to be clear about what you actually want to compare.
1. One brand is running multiple ad accounts
A business may have separate Meta ad accounts for different countries, products, business units, websites, or currencies.
For example, an ecommerce brand may use one ad account for India, another for the US, and another for the UK. The marketing team may want to see the brand’s total advertising performance while still comparing each market separately.
In this case, cross-account analysis can help answer questions like:
Which market has the highest ROAS?
Where is customer acquisition becoming more expensive?
Which country has the strongest conversion rate?
Is one account receiving too much or too little budget?
Are the same creatives working across different regions?
Even though the accounts belong to the same brand, you still need to consider differences in currency, product pricing, customer behaviour, competition, and average order value.
2. An agency wants an overview of all client accounts
An agency managing 20 clients does not need to audit all 20 accounts every morning.
The first task is to identify which accounts are stable, which ones improved, and which ones need attention. Once you have that shortlist, you can spend more time investigating the accounts where something actually changed.
An agency-level comparison may include:
Week-over-week changes in spend and results
Accounts with a sudden CPA increase
Accounts where ROAS declined
Campaigns spending without generating conversions
Unusual changes in CPM, CTR, or frequency
Accounts approaching their monthly budgets
Clients who need an immediate performance update
This gives the performance team a place to start instead of treating every account as equally urgent.
3. You want to compare brands from the same industry
Suppose your agency works with five skincare brands or several local real estate businesses.
Because the accounts operate in a similar niche, you may want to understand what is working across them. You could compare audience costs, CTR, conversion rates, offers, placements, landing pages, and creative formats.
For example, you may notice that product-demonstration ads perform well across four skincare brands, while heavily designed promotional images consistently receive a lower CTR.
That does not mean every brand should achieve the same result. Geography, price, budget, brand awareness, and funnel quality can create major differences.
Use the comparison to identify patterns worth investigating, not to create one universal benchmark for every account.
4. You implemented the same change across several accounts
Cross-account analysis for Meta Ads is also useful when you want to evaluate a common change.
Perhaps you introduced a new creative testing process across six accounts. Or you moved several campaigns to Advantage+, changed the landing pages, launched a new offer, or restructured the budgets.
Instead of checking each account separately, you can compare the group before and after the change.
This can help you understand:
Whether the change improved overall performance
Which accounts benefited most
Whether the result varied by market or budget
Whether any account performed worse
Whether the improvement was consistent or driven by one outlier
If possible, compare the affected accounts with similar accounts where the change was not introduced. That gives you a stronger baseline than a simple before-and-after comparison.
You need one consolidated report
Sometimes the requirement is much simpler.
A founder, marketing head, or client may want one report showing the total spend, conversions, revenue, and performance across all accounts.
They may also want to see:
Results by brand, product, or region
Budget pacing
Changes from the previous period
Accounts that need attention
Combined totals for management reporting
In this situation, Meta’s native cross-account report may be all you need.
Now that the different use cases are clear, let’s look at how you can create that report inside Meta.
How to create a cross-account report in Meta Ads Manager?
Meta provides a native cross-account reporting feature inside Ads Reporting.
This means you do not have to open every account separately or export each report before combining the data in a spreadsheet.
Before you begin, make sure you have access to every account you want to include. If you manage client accounts, ask the client to add your business as a partner or assign the required permissions through Meta Business Portfolio.
Meta Business Portfolio is the current name for what many marketers still call Facebook Business Manager.
If you are still organizing your account structure, our Facebook Ads setup guide explains how Business Portfolios, ad accounts, Pages, and permissions work together.
Only eligible accounts that you have permission to access will appear in the account selector.
What can you see in a Meta Ads cross-account report?
Once you select the accounts, you can apply a common set of columns across all of them.
Depending on the campaigns and conversion events, you may be able to compare different Facebook ads metrics:
Amount spent
Reach
Impressions
CPM
Link clicks
CTR
CPC
Results
Cost per result
Leads
Purchases
Purchase conversion value
Cost per purchase
ROAS
Meta also lets you break down cross-account data by age, gender, country, region, placement, and device. These breakdowns can help explain why two accounts show different results.
For example, one account may have a much higher CPM because it targets the US, while another targets India. A second account may have a lower CPA because most of its budget goes to remarketing audiences.
If you only compare the final CPA or ROAS, you miss the conditions behind those numbers.
Not directly. Meta Ads Reporting supports recurring email delivery for reports containing one ad account. However, according to Meta’s current reporting guidance, cross-account reports cannot be scheduled for email.
That does not mean recurring cross-account reporting is impossible. You just need to set it up outside Meta Ads Reporting.
One option is to connect your Meta Ads data to ChatGPT or Claude through an MCP server. The MCP connection gives the assistant access to your accounts and campaign data. You can then combine it with a supported scheduled task, routine, or external automation tool to run the analysis at a fixed time.
For example, you could create a workflow that:
Fetches data from selected Meta ad accounts every Monday
Compares the last seven days with the previous seven days
Flags accounts where CPA or ROAS changed significantly
Prepares a summary
Sends the result by email or saves it to a document
This route gives you more control, but it also requires you to find or build the right MCP server, configure account access, create the analysis instructions, and maintain the scheduling workflow.
The other option is to use a marketing analysis workspace where the account connections and scheduling are already part of the product.
For example, Vaizle lets you select multiple Meta ad accounts, define the analysis you want to run, and schedule it as a recurring check. The results can then be sent by email or written to a connected Google Sheet.
We’ll explain how this works later in the article. For now, the main difference is simple: Meta can create the cross-account report, while an MCP workflow or a product such as Vaizle is needed if you want that analysis to run automatically.
With the reporting options clear, the next step is to make sure the accounts are being compared correctly. Different objectives, currencies, attribution settings, and conversion volumes can otherwise make the combined report misleading.
When is Meta’s cross-account reporting enough?
Meta Ads Reporting works well when you already know what information you need.
You can select the accounts, use a common set of metrics, add relevant breakdowns, and export the result. This is usually enough for a consolidated performance table or a report that you plan to review manually.
It also keeps you close to Meta’s source data. If a number looks unusual, you can open the relevant account and investigate the campaigns directly.
The limitation appears when you need to understand why something changed.
A cross-account report may show that one account’s CPA increased by 30%. It will not automatically tell you whether the increase came from higher CPM, weaker CTR, lower conversion rate, budget movement, or one poorly performing campaign.
That part still depends on how you analyze the report.
How to compare multiple Facebook ad accounts correctly?
Bringing several accounts into one report does not automatically make them comparable.
Different campaign objectives, currencies, attribution settings, budgets, and conversion volumes can distort the result. So before ranking the accounts, you need to create a fair basis for comparison.
1. Start with a clear question
“Show me everything” usually creates a crowded report with no clear takeaway.
Start with the decision you need to make.
For example:
Which client accounts need attention this week?
Which regions are acquiring customers most efficiently?
Did the new creative process improve performance?
Which accounts are likely to miss their monthly target?
Where did CPA increase compared with the previous period?
Which brands are showing signs of creative fatigue?
Once the question is clear, it becomes easier to choose the accounts, metrics, dates, and breakdowns you need.
2. Group accounts with similar goals
Avoid placing every available account into one ranking.
Instead, create logical groups such as:
Ecommerce accounts
Lead generation accounts
Awareness accounts
Accounts from the same market
Accounts from a similar industry
Accounts with similar spending levels
Accounts affected by the same change
You can still include accounts with different objectives in one report. Just avoid judging all of them using the same primary metric.
3. Choose metrics that match the objective
ROAS is useful for an ecommerce purchase campaign. It tells you very little about a campaign designed to maximize video views.
Use primary metrics to evaluate the outcome and supporting metrics to understand why that outcome changed.
Account objective
Primary metrics
Supporting metrics
Ecommerce sales
Purchases, revenue, ROAS, cost per purchase
CPM, CTR, CPC, conversion rate, average order value
Lead generation
Leads, qualified leads, cost per lead
CTR, CPC, landing page conversion rate
Website traffic
Landing page views, cost per landing page view
Link clicks, CTR, CPC
Awareness
Reach, impressions, CPM
Frequency, engagement rate
Video views
ThruPlays, cost per ThruPlay
Watch time, completion rate, CPM
A high CPM does not automatically mean an account is performing poorly.
If CPM increased but conversion rate and average order value also improved, the account may still produce a stronger ROAS. That is why you need to look at how the metrics affect one another.
4. Use the same reporting period
Every account should use the same date range when you compare performance.
A seven-day account view should not be ranked against another account using 30 days of data.
For regular account reviews, you could compare:
Last seven days against the previous seven days
Last 30 days against the previous 30 days
This month against the same number of days last month
A campaign period against the same period before launch
Also check whether one period contained a sale, holiday, campaign launch, or other event that could affect the result.
5. Check attribution settings
Two accounts can report different conversion results because they use different attribution settings.
Before comparing purchases, leads, CPA, or ROAS, check whether the selected accounts use comparable attribution windows.
If you changed the attribution setting in some accounts, the reported difference may come from measurement rather than an actual change in campaign performance.
6. Account for different currencies and time zones
Avoid adding dollars, pounds, euros, and rupees into one spend total.
Convert the monetary values into a shared currency before calculating total spend, revenue, CPA, or CPC.
You can compare ratios such as CTR, conversion rate, frequency, and ROAS without adding the currencies together. Even then, consider differences in product margin, customer value, and business goals.
Time zones can also affect the comparison.
Two accounts may show different daily totals because their reporting days start and end at different times. This becomes more noticeable when you analyze short periods or accounts with high daily spending.
7. Check whether there is enough data
A large percentage change may be caused by a very small number of conversions.
For example, moving from two purchases to three purchases is a 50% increase. But it is not enough evidence to say that the account has found a reliable way to improve performance.
Before reacting, check:
Amount spent
Number of conversions
Length of the change
Daily consistency
Whether the pattern appears across several campaigns
Whether one high-value purchase distorted the ROAS
Percentage changes need enough volume behind them.
8. Find the outliers first
If you manage several accounts, start by finding the accounts where something unusual happened.
Look for:
CPA increases
ROAS declines
Spend increases without more conversions
Sudden CPM changes
Falling CTR
Rising frequency
Campaigns spending without results
Accounts likely to exceed or miss their budgets
This gives you a shortlist of accounts to investigate.
You do not need to review every campaign in every account each morning. Start with the accounts where performance moved outside its normal range.
9. Move from the account to the source of the change
Account-level data tells you where the problem is. It rarely tells you what caused it.
If an account’s ROAS dropped, move through the following levels:
Campaign
Ad set
Audience
Placement
Ad
Creative
Landing page
Conversion event
Then look at how the supporting metrics changed.
For example:
A CPM increase points towards more expensive ad delivery
A CTR decline may indicate weaker creative or audience response
Stable CTR with a lower conversion rate may indicate a landing page or offer problem
Stable CPA with lower ROAS may point towards a lower average order value
Rising frequency with falling CTR may indicate creative fatigue
If the issue appears across the entire account, use our Facebook Ads audit guide to review the campaign structure, budgets, tracking, audiences, and creatives.
How to evaluate a change across several Facebook Ads accounts?
If you introduced the same change across several accounts, avoid looking only at the combined result.
Start by recording:
When the change was introduced
Which accounts received it
Which accounts did not
Which metric you expected to improve
Which supporting metrics could explain the result
Then compare equal periods before and after the change.
Suppose you introduced a new creative testing process across six ecommerce accounts on August 1. You could compare CTR, cost per purchase, conversion rate, ROAS, and the number of winning creatives before and after that date.
If possible, compare these results with similar accounts where the process did not change.
This helps you separate the effect of your change from seasonality, market demand, promotions, or wider changes in Meta’s ad delivery.
Be careful when comparing Meta Ads with Shopify
For ecommerce accounts, Meta Ads data may not match the purchases and revenue you see in Shopify.
For example, Meta may report 100 purchases while Shopify attributes only 82 orders to Facebook or Instagram. Revenue and ROAS may look different as well.
That does not automatically mean your tracking is broken.
Meta and Shopify use different attribution rules and methods for assigning credit. Meta can count conversions after an ad click or view within its attribution window, while Shopify relies on its own session, channel, and order data.
Before flagging an account for incorrect tracking, check how each platform calculated the result.
When do you need more than Meta’s cross-account report?
If you only need a combined table, Meta Ads Reporting may be enough.
A separate analysis tool becomes useful when you repeatedly need to find the accounts that require attention, investigate performance changes, add business context, or bring in data from other platforms.
This is where Vaizle becomes relevant.
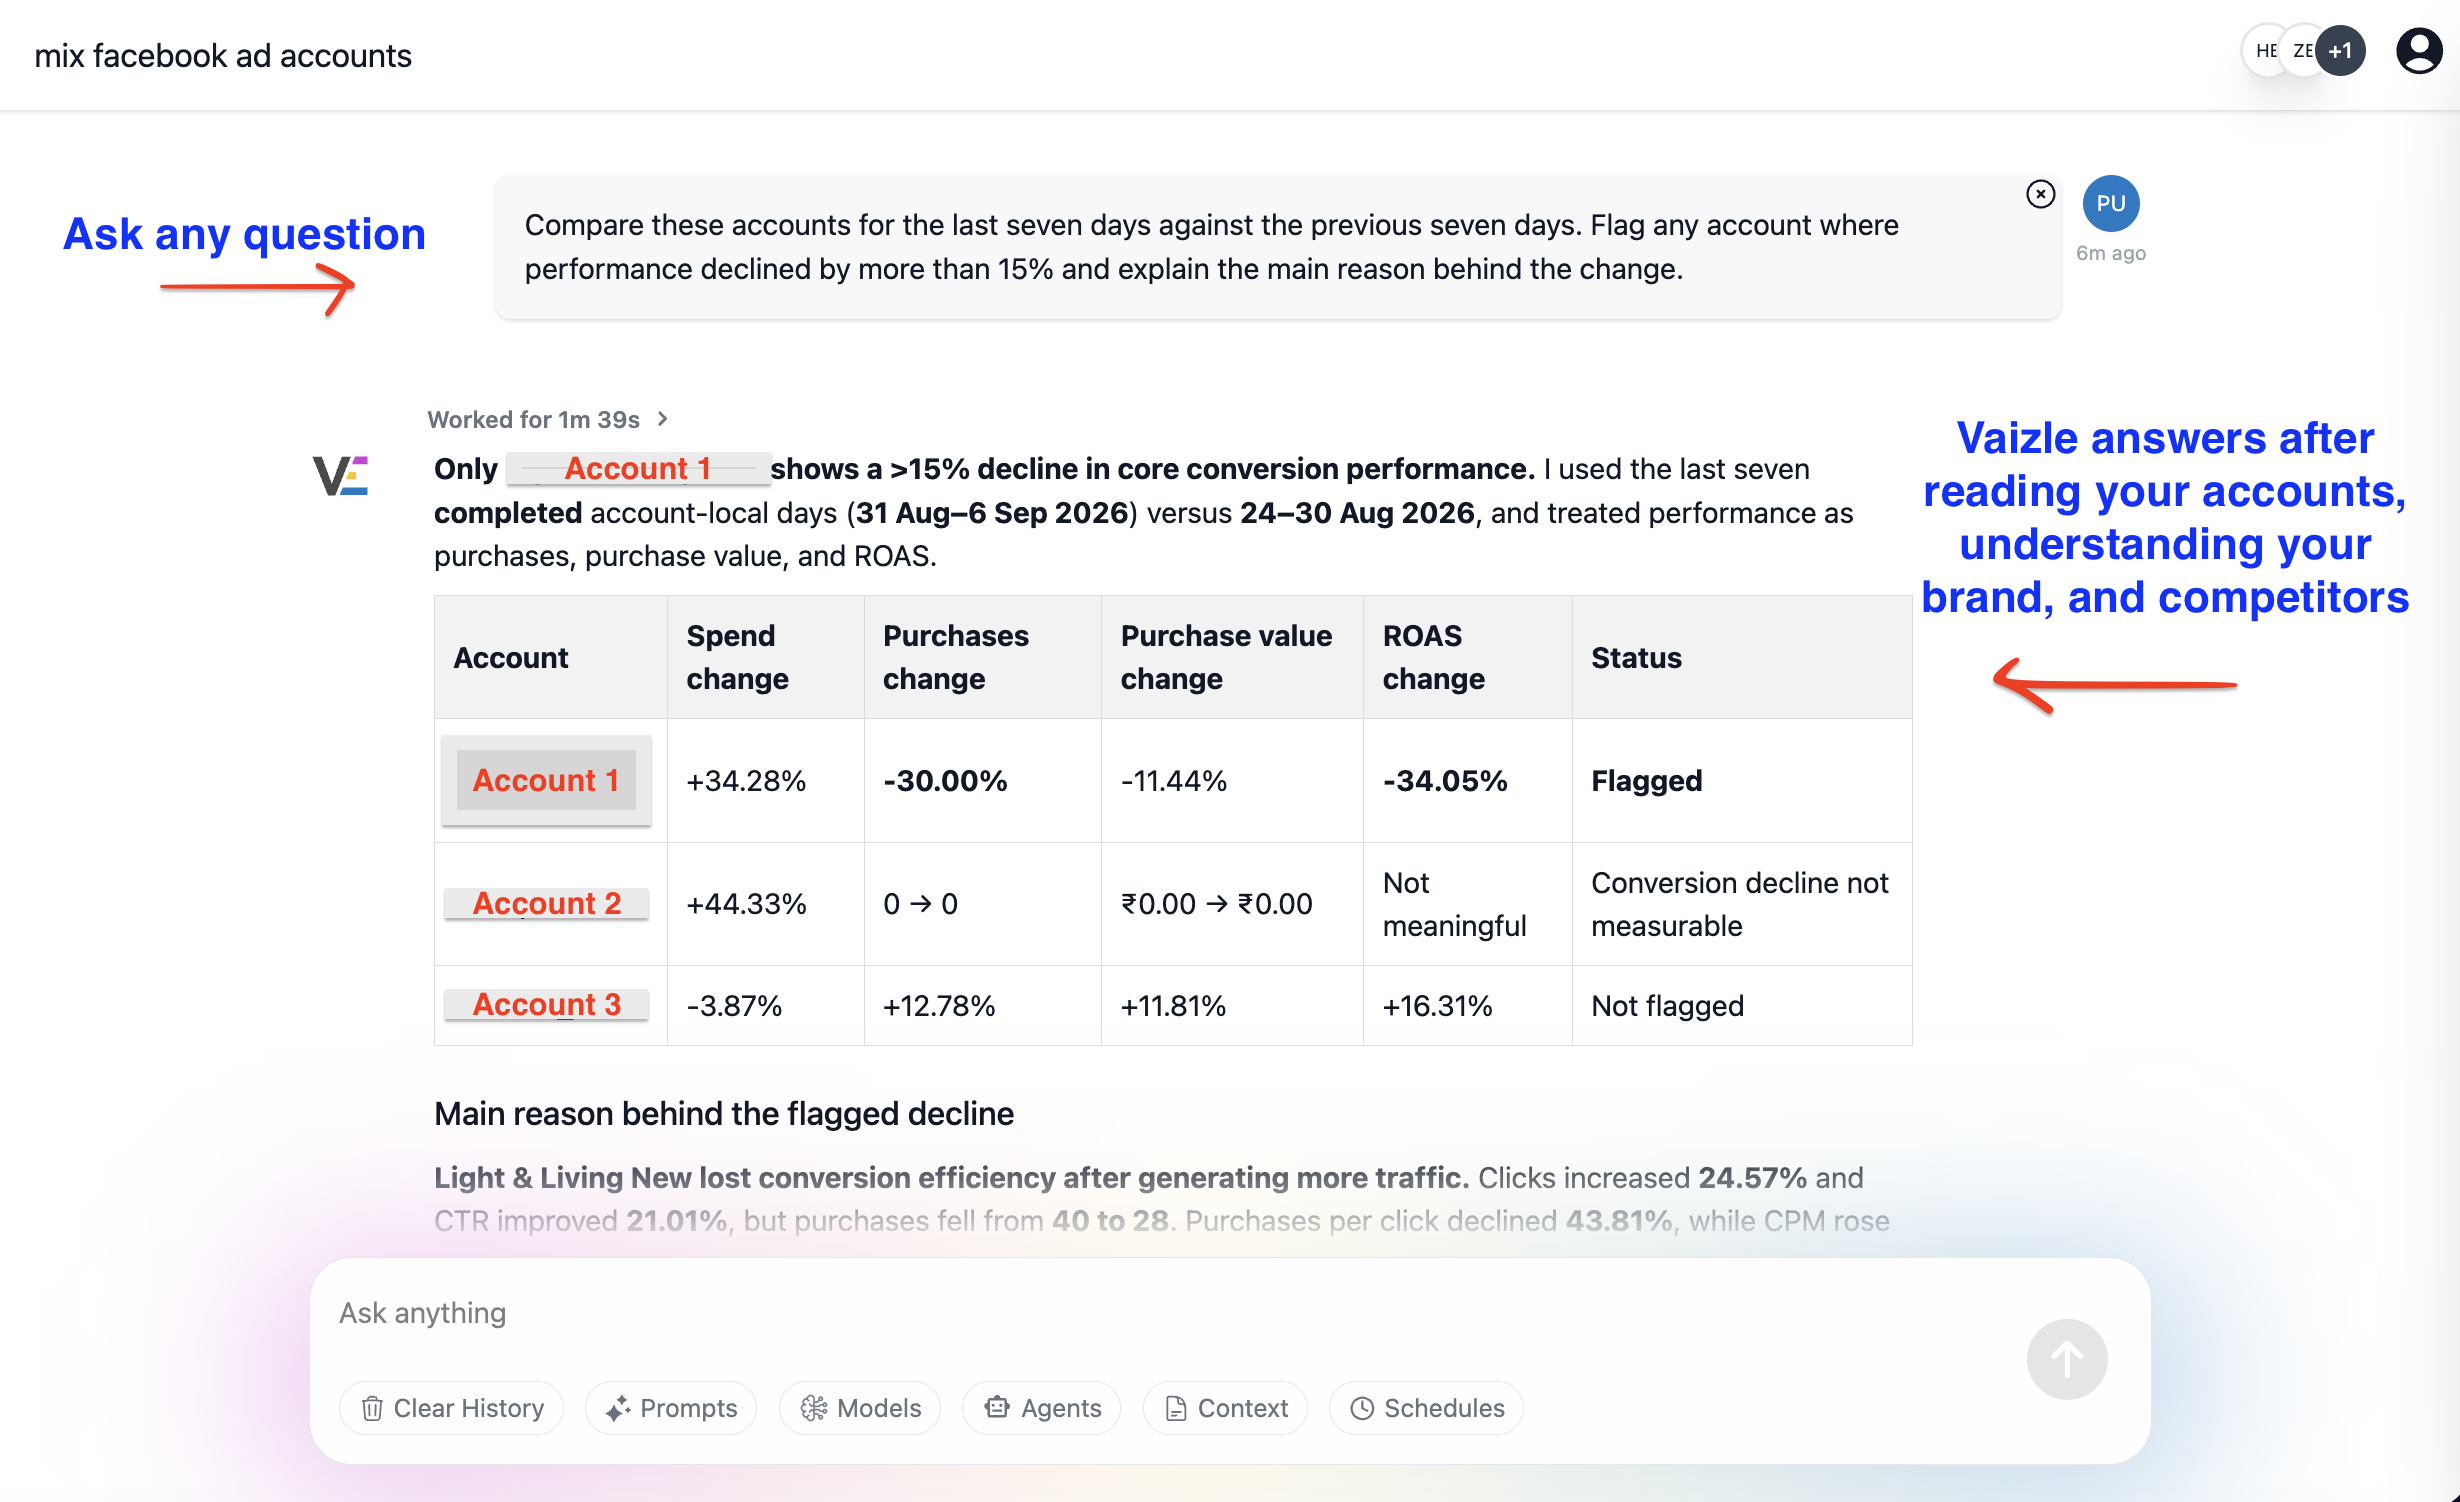
Vaizle is a marketing analysis workspace connected to your account data. You can select multiple Meta ad accounts in one analysis session, add brand and competitor context, define how each account should be evaluated, and continue asking questions about the results.
For example, you could start with:
Compare these ecommerce accounts for the last seven days against the previous seven days. Flag any account where ROAS declined by more than 15% and explain the main reason behind the change.
You can then continue with:
Which campaigns contributed most to the decline?
Did CPM increase, or did conversion rate fall?
Which ads lost the most efficiency?
Are the static creatives showing signs of fatigue?
Because the accounts and earlier analysis remain available in the session, you do not have to upload a new spreadsheet or explain the original question each time.
Vaizle can also combine Meta Ads with Shopify, Google Ads, GA4, LinkedIn Ads, TikTok Ads, social pages, and competitor data. This helps when the answer cannot be found inside Meta alone.
You can turn a repeated analysis into a scheduled workflow as well.
For example:
Every Monday, compare the last seven days against the previous seven days across all selected accounts. Flag any major increase in CPA, decline in ROAS, or increase in spend without a matching increase in results. Email me a summary of the accounts that need attention.
Vaizle supports analysis and reporting, while Meta Ads Manager remains the place where you verify the latest data and make campaign changes.
Case Study: What this looks like across 55+ client accounts?
XOR Labs uses Vaizle to analyze and report on marketing performance across more than 55 active clients.
The agency reported around 75% less reporting time. A complete account audit that previously took six to seven hours came down to about two hours.
Here are a few questions you can use while creating or reviewing your report.
For an agency portfolio
Which client accounts had the largest performance decline this week?
Where did spend increase without a similar increase in results?
Which accounts are likely to miss their monthly target?
Which clients need an immediate performance update?
For one brand with several accounts
Which regional account has the strongest ROAS?
Where is customer acquisition becoming more expensive?
Which products or markets should receive more budget?
Are the same creatives working across every region?
For brands from a similar industry
Which accounts have the strongest CTR and conversion rate?
Are any offers consistently outperforming across the group?
Which creative formats work across several brands?
Is higher CPM connected to better conversion quality?
For measuring a common change
Did performance improve after the new campaign structure was introduced?
Which accounts benefited most from the change?
Did the result vary by budget, objective, or market?
Did accounts without the change show a similar movement?
Final takeaway
Meta Ads Reporting gives you a native way to analyze multiple Facebook ad accounts together.
It works well when you need a consolidated report, common metrics, detailed breakdowns, or an export covering several accounts.
But the report is only as useful as the comparison behind it.
Group similar accounts, choose metrics that match their objectives, use consistent reporting periods, check currencies and attribution settings, and investigate the source behind every major change.
If you only need to bring the numbers together, start with Meta’s cross-account reporting.
If you repeatedly need to investigate those numbers, compare Meta with other platforms, add brand and competitor context, or schedule the same review, Vaizle can handle that additional analysis.
1. Can I view multiple Facebook ad accounts at the same time?
Yes. Meta Ads Reporting lets you create a cross-account report using eligible ad accounts you have permission to access.
You can apply the same metrics, breakdowns, and reporting period across the selected accounts.
2. What is Facebook cross-account reporting?
Facebook cross-account reporting is a feature inside Meta Ads Reporting that combines performance data from multiple ad accounts into one report.
You can use it to compare accounts, apply detailed breakdowns, save the report, and export the data.
3. How do I create a cross-account report in Meta?
Open your Meta Business Portfolio and click All tools. Under Analyze and report, select Ads Reporting, create a new report, and choose the accounts you want to include.
4. Can Meta email a recurring cross-account report?
No. Meta currently supports recurring email delivery for single-account reports, but not for cross-account reports.
You can save and revisit the report or use a separate workflow to schedule a recurring multi-account review.
5. Can I compare Facebook ad accounts with different objectives?
Yes, but use metrics that match each objective.
For example, use purchases and ROAS for ecommerce, qualified leads and cost per lead for lead generation, and reach or CPM for awareness campaigns.
6. Can I compare accounts using different currencies?
Yes, but avoid adding the raw monetary values together.
Convert every account into the same currency before calculating combined spend or revenue. You can also compare ratios such as CTR, conversion rate, frequency, and ROAS.
7. Can I compare accounts belonging to different brands?
Yes, provided you have permission to access the accounts.
Use the comparison to identify patterns across similar brands, but consider differences in geography, budget, price, brand awareness, offers, and funnel quality.
8. Do I need another tool to analyze multiple Meta ad accounts?
Not necessarily. Meta Ads Reporting may be enough if you only need a consolidated report.
Another tool becomes useful when you need scheduled multi-account checks, contextual follow-up analysis, cross-platform data, or recurring client summaries.
9. Can I analyze Meta Ads and Shopify data together?
Yes. Combining both sources can help you compare Meta-attributed purchases with actual Shopify orders and revenue.
The numbers may not match exactly because Meta and Shopify use different attribution methods.
Siddharth built two bootstrapped companies from the ground up: Vaizle and XOR Labs. He’s personally managed over Rs 100cr in ad budget across eCommerce, D2C, ed-tech, and health-tech segments. Apart from being a full-time marketer, he loves taking on the challenges of finance and operations. When not staring at his laptop, you’ll find him reading books or playing football on weekends.