


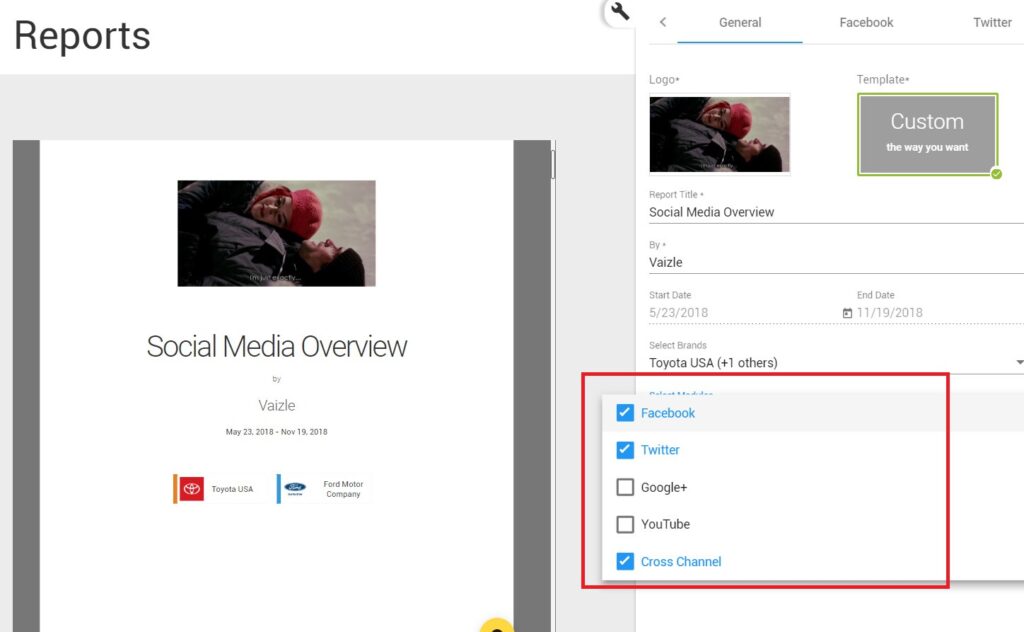
When you go into ‘Reports’ section in Vaizle, you will see two sections.
You can create any social media channel you want. Or even combine only two or three social media channels for a cross-channel report.
You can select the social media channel(s) you want to create report for from ‘Select Modules’ drop-down.
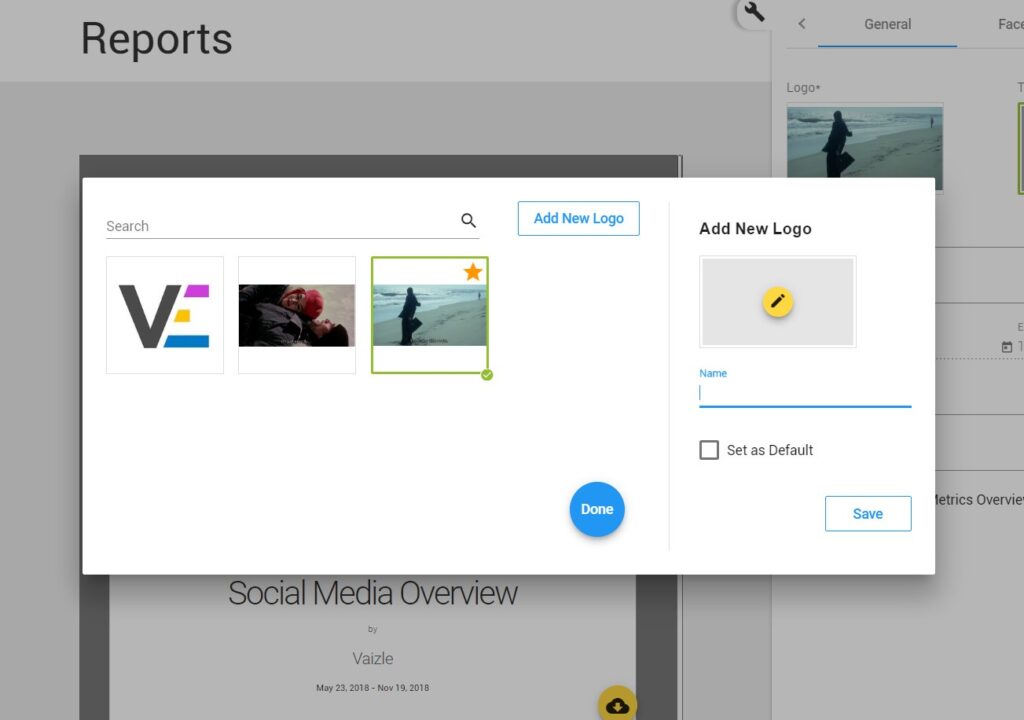
In the right part of the reporting section, under the ‘Logo’ text, click on the logo image
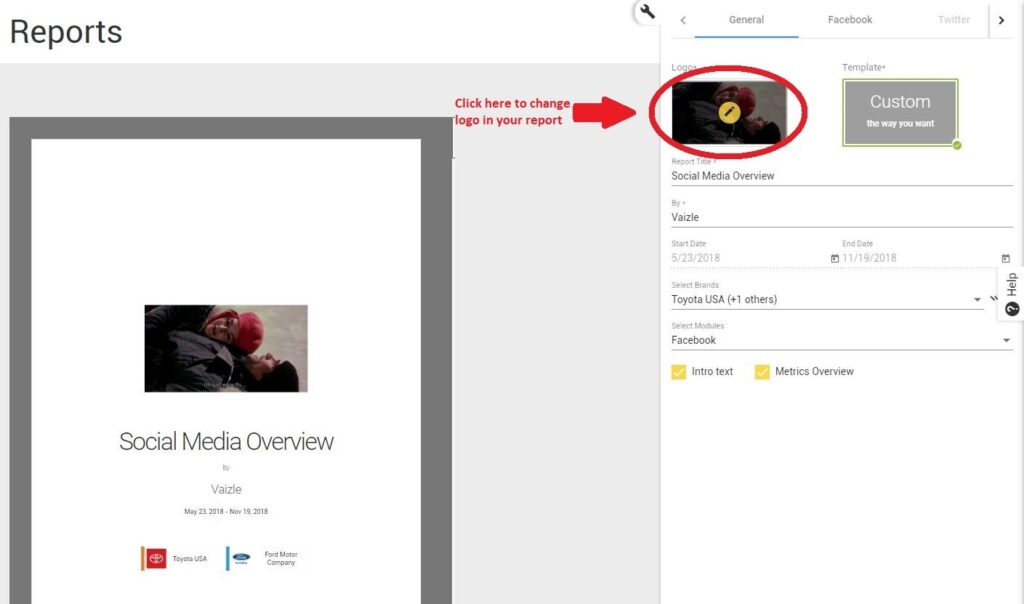
Then select the file (logo) you want to replace it with. Your can even set a logo as default by marking the check button in the right section.
You will be able to see the change right away in the live report preview section.
Adding notes and comments in reports is one of the most coveted feature by agencies. And that’s why we wanted to help agencies add their own views of the report. It also helps clients understand reports better–a win-win situation for all of us.
You can add notes in your report in two ways:
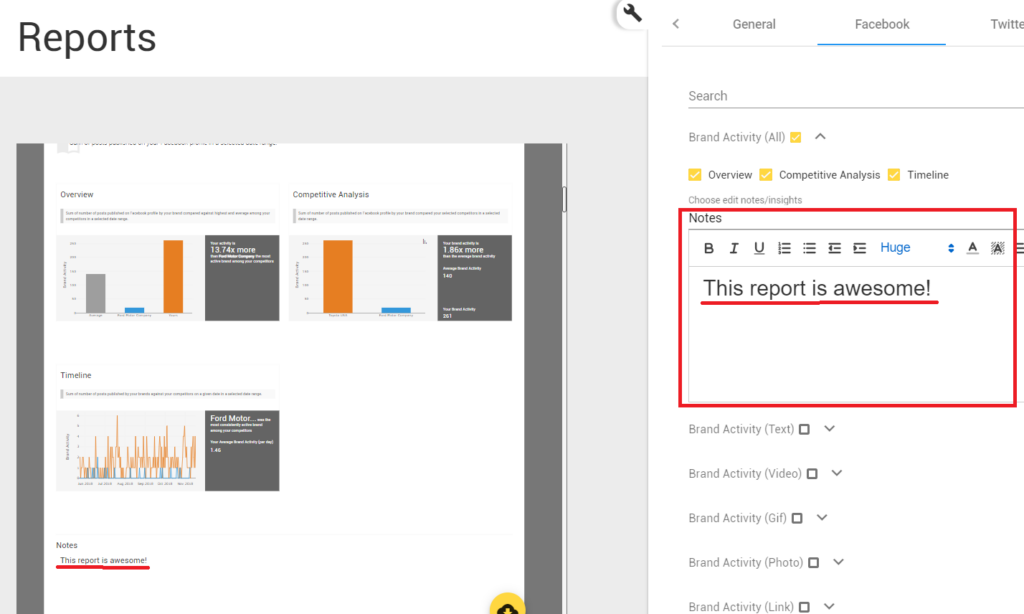
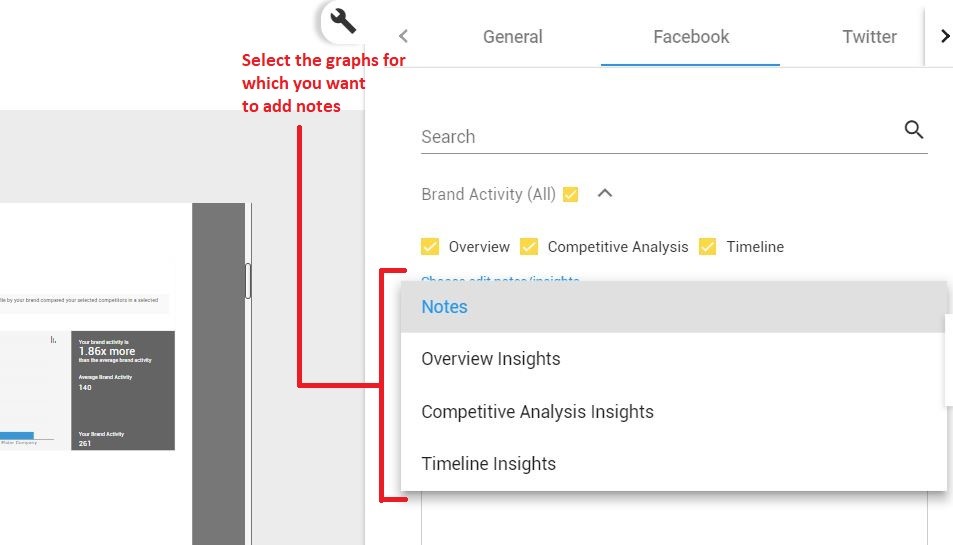
To add notes on a page
Step 1: Click on the arrow button for a graph page. A menu will appear with text-editor.
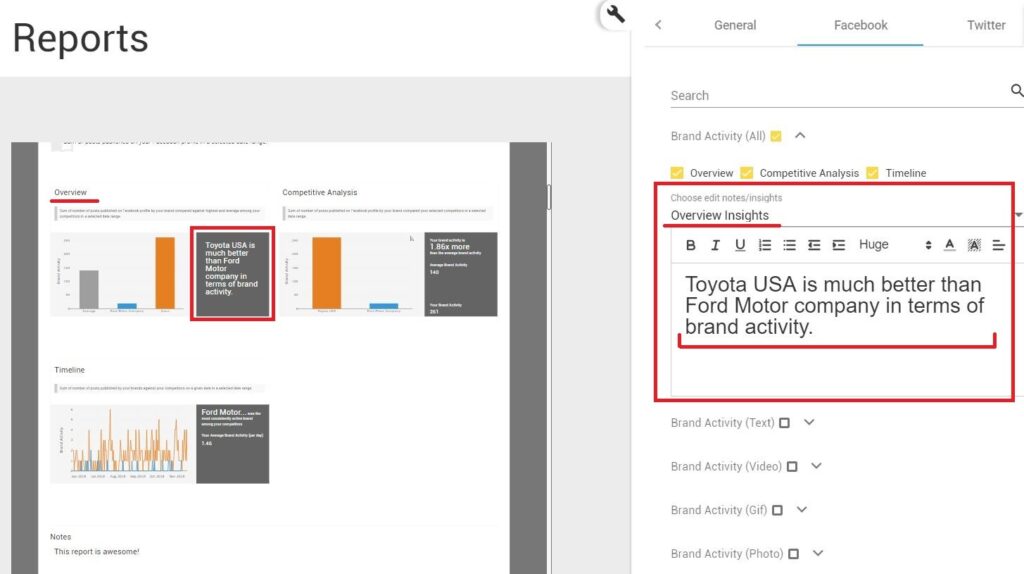
Step 2: Now, in the text-editor, enter your own words. You can see its live preview as well.
Step 3: The ‘Notes’ section comes with a text-editor so you can also format your notes.
To add notes with a graph:
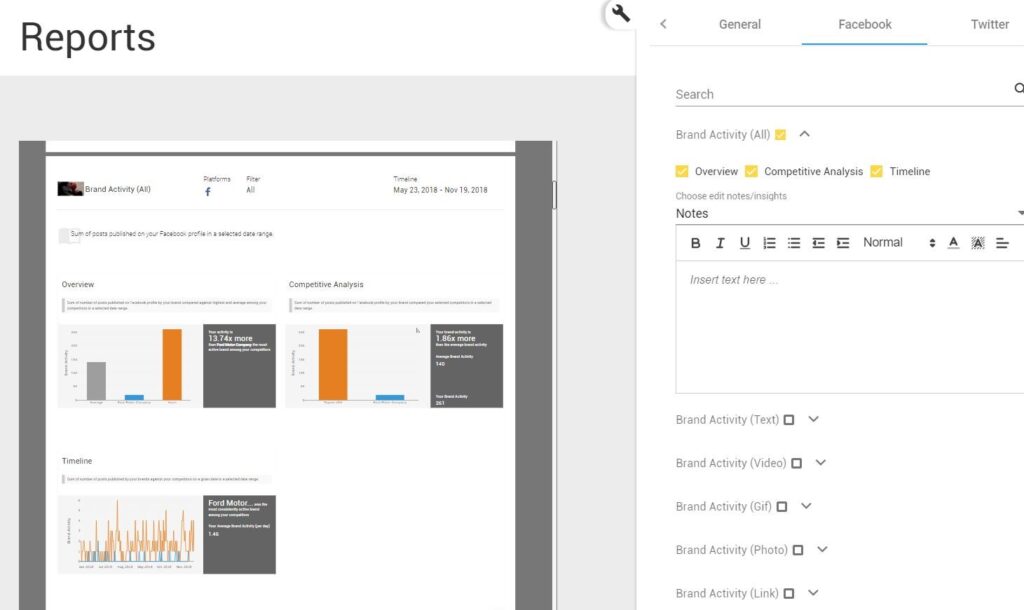
Step 1: Click on the arrow button for a graph page.
Step 2: Click on the drop-down where you see ‘Notes’
Step 3: In the text-editor, enter your notes. You can see its live preview as well.
After you have selected social media channels and the brands you want to create the report for, select the social media tab or the ‘Cross-channel’ tab at the top corner. In the example above, I have chosen ‘Facebook’ tab.
Each tick-mark in the list means one page of graphs:
To add or remove a page, simply ‘Check’ or ‘Uncheck’ the box respectively from the list of pages.
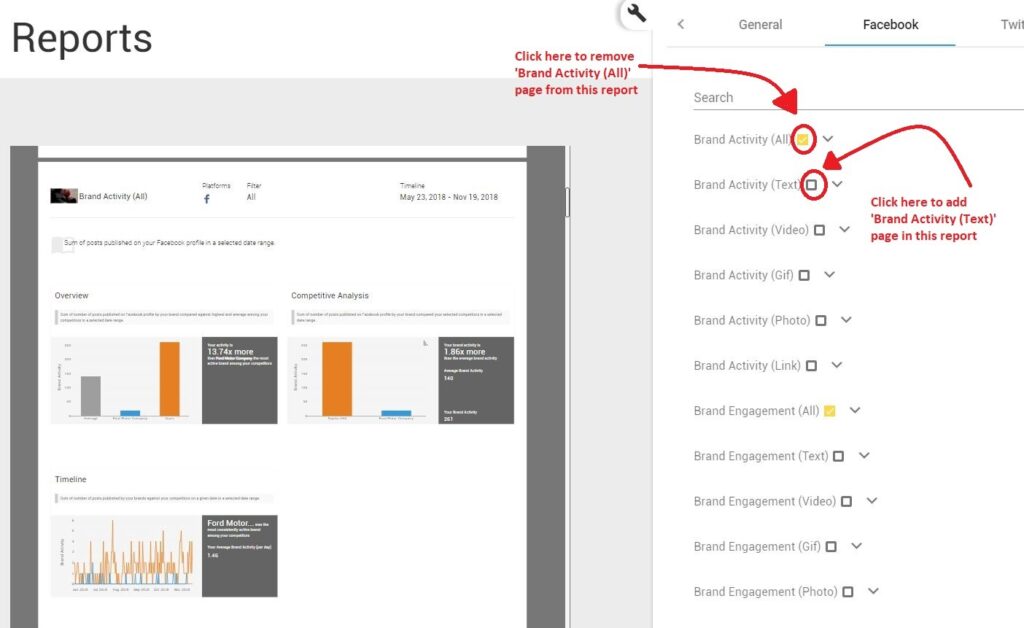
If you want to remove a particular graph from a page, click on the drop-down arrow for a page, and ‘Uncheck’ the box to remove a graph from a page.
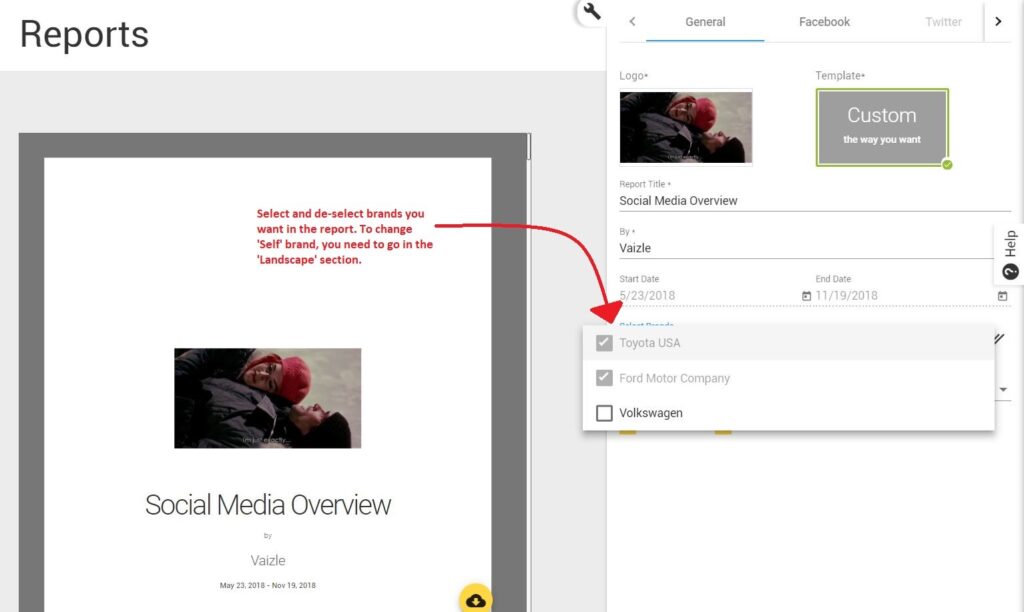
Vaizle allows you to perform competitive analysis. So you need at least two brands for the comparison. By default, these two brands are automatically selected.
The ‘Self’ brand is always automatically selected and cannot to be changed from the reporting section. To change your ‘Self’ brand in the reports, you need to change it in the ‘Landscape’ section 1.
To change competitors, click on the ‘Select Brands’ drop-down and choose the brands you want in a report. You can select all the brands by clicking on the ‘Double-check’ icon.
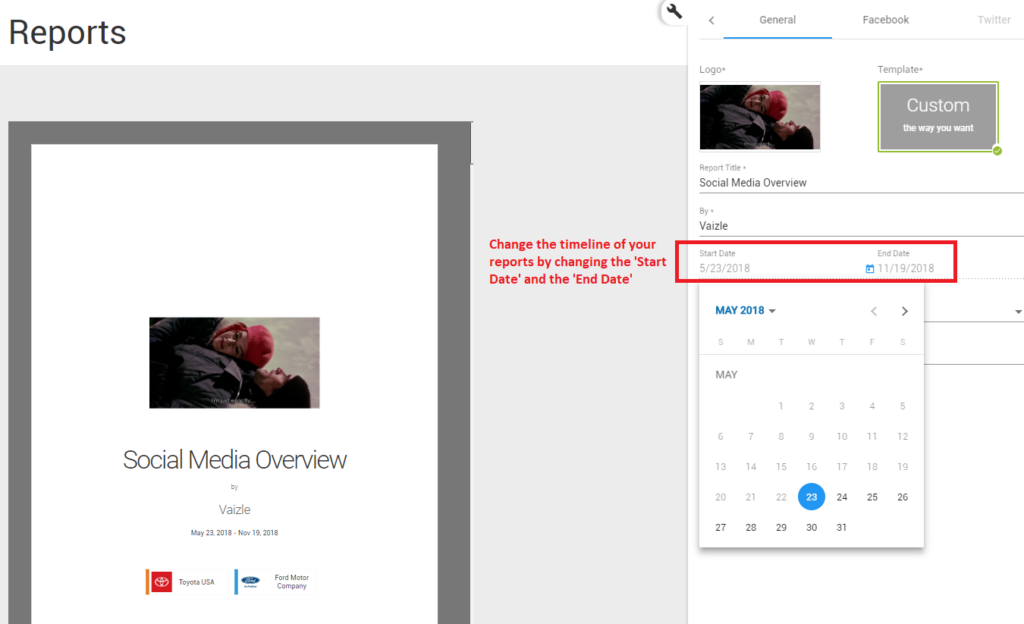
In the right-section of ‘Reports’, you will see two date-fields: Start date and End date.
You can change both the dates as you need. However, you cannot change the ‘Start date’ beyond six months since the days you signed up.
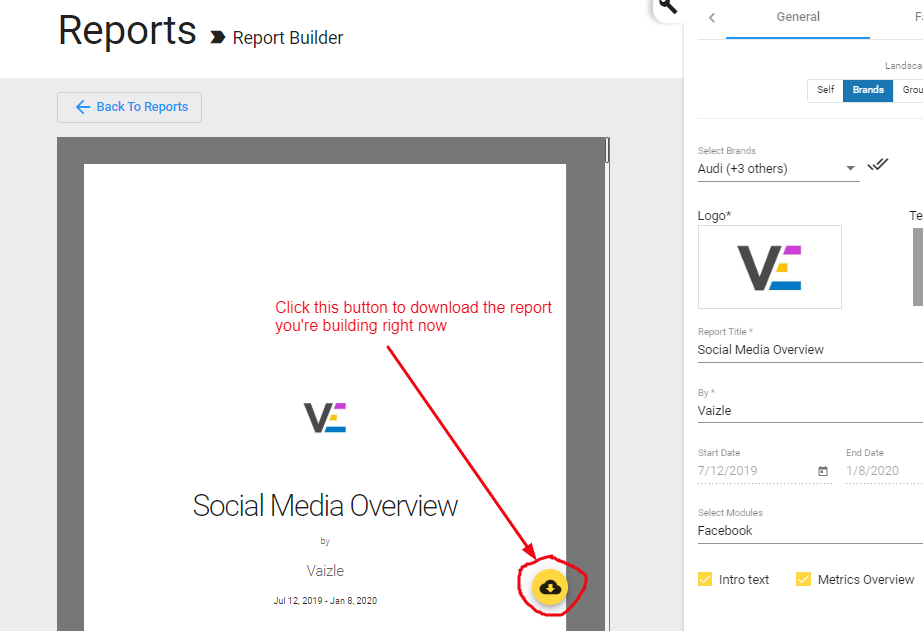
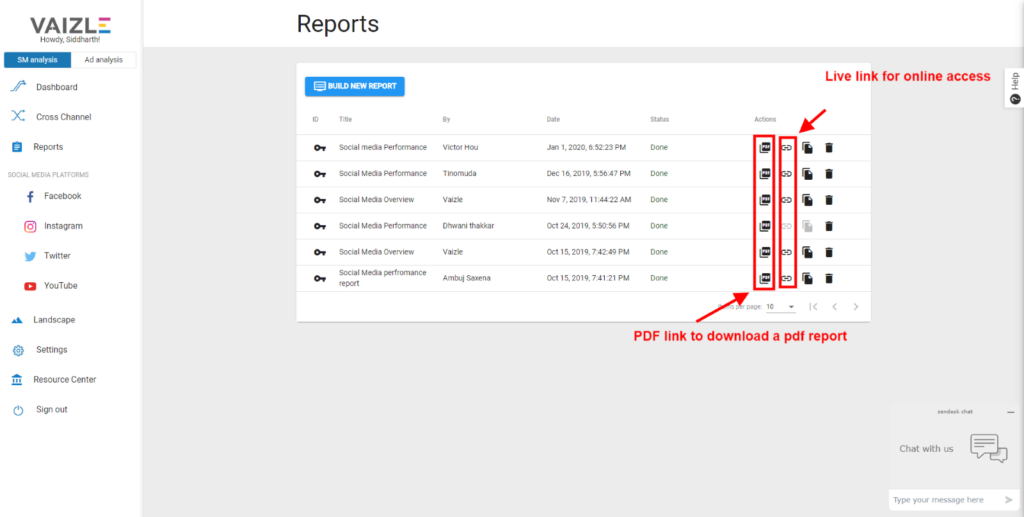
You can download the reports in PDF format.
We also understand that people may need reporting in JPG and PPT formats too. So we are exploring our options to add some new report formats.
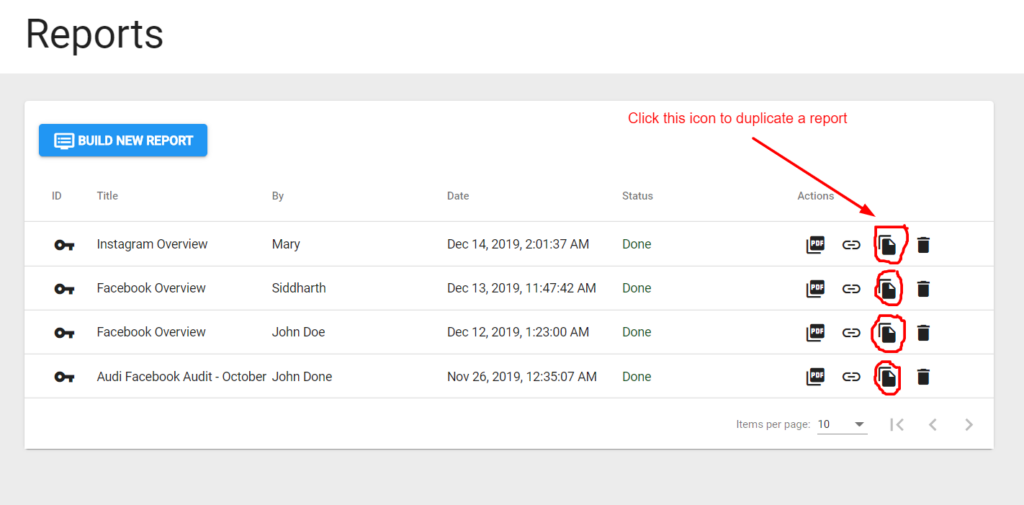
You can use any report that you’ve created as a template. You can do so by duplicating it.
To duplicate a report, click on the copy button in the report listing section. See the image below
Vaizle is using the latest Instagram API which is more secure and designed to protect user privacy.
However, the latest Instagram API does not provide public videos thumbnail URL. So it’s not possible to show the thumbnails of videos
However, you can add the thumbnails of the top image posts.
At Vaizle, we track thousands of company across the world to publish social media reports. These reports are quarterly and annual social media reports on:
We have made these reports paid. However, for Vaizle users, these reports will be available for free. You can check some of the reports on our website: https://vaizle.com/social-media-reports
You can share report in either of the following ways:
You can download the report by clicking on the PDF button in the report listing window and pasting it in the browser. Or by clicking the download button from the report builder window.
Now you don’t need to download the report in PDF and then share it with the client. You can simply click on a link to copy the URL of the report available on Vaizle server.
Arushi is a proficient SEO and ASO specialist with a 5-year track record working for B2B and B2C organizations. Currently, she is heading SEO strategy for Vaizle and helping businesses improve their online presence. A mountain girl at heart, she likes to recharge her creative abilities by taking long walks and listening to podcasts.
Copyright @VAIZLE 2024