Understanding how your website is performing is crucial, and Google Analytics 4 (GA4) is the web analytics tool millions rely on for this. In fact, 55.5% of websites now use GA4 to track their performance.
But let’s be honest—it’s not the easiest platform to dive into, especially if you’re just getting started. From wondering what is GA4 to searching how to create reports, you are bound to have multiple queries while getting started.
In this blog, I will cover GA4 basics that will familiarize you with platform’s interface, reports, and navigation. Let’s get started.
Google Analytics 4 (or GA4) is Google’s latest tool for tracking and understanding how people interact with your website or app. It’s designed to give you a deeper look into your customer’s journey, from the first time they visit to how they engage with your content, make purchases, or return for more.
Unlike Google’s last web analytics tool (Universal Analytics), GA4 focuses majorly on events instead of sessions. This means every action—like clicks, scrolls, or purchases—is treated as valuable data.
What I like best about GA4 is that it’s more flexible and customizable. You decide what’s important to measure for your business. Whether you want to improve your marketing or boost sales, GA4 helps you get the insights you need, all while respecting evolving privacy standards.
GA4 takes a new approach compared to Universal Analytics, making it better suited for business owners wanting to track user journey.
Here’s are the key differences between GA4 and Universal Analytics:
In addition to all these differences, Google has gone a step further to address privacy concerns and comply with GDPR and CCPA (California Consumer Privacy Act) laws. Now, it is possible for website owners like you to track data without needing third-party cookies.
Google Analytics 4 is entirely dependent on first-party cookies and Machine Learning insights to present user data.
To summarize in one sentence–we can say that GA4 is a much flexible and smarter way to analyze user behavior than UA.
If you’re a new business owner with website or app data to track, get started by completing the GA4 setup first.
Here’s what the entire process will look like:
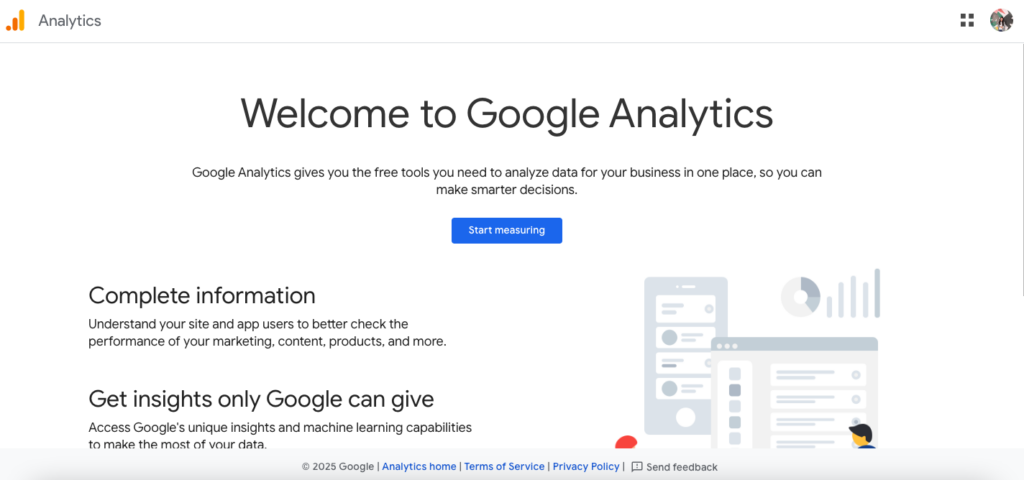
Go to analytics.google.com and click on the “Start Measuring” button.

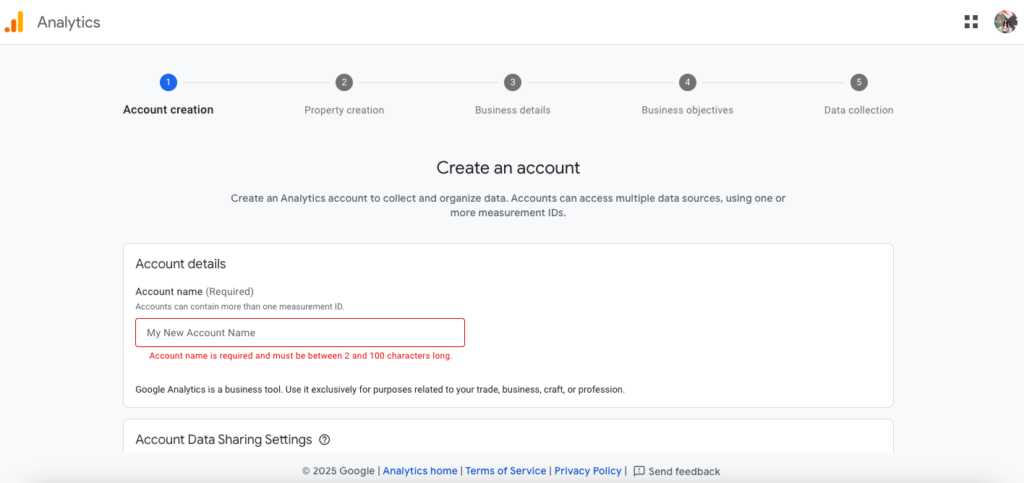
You’ll need a Google account – if you don’t have one, you’ll need to create it first. Once logged in, click the “Create Property” button and enter your website’s name and basic details.

Now, after creating your property, GA4 will guide you through the setup process. You’ll get a tracking code snippet that looks something like this:
<!– Google tag (gtag.js) –>
<script async src=”https://www.googletagmanager.com/gtag/js?id=G-XXXXXXXXXX”></script>
This code needs to be added to every page of your website. If you’re using WordPress, you can install a plugin or simply paste the code in your theme’s header. For other platforms like Shopify or Wix, you’ll find a dedicated field in your site settings for Google Analytics tracking code.
Once done, you can start tracking default events (e.g., page views, scrolls) that are automatically set up by Google Analytics. You can also create custom events relevant for your business (like form submissions or profiles analyzed).
Now, let’s understand how to navigate GA4.
The GA4 dashboard might seem overwhelming at first. With all the graphs and screens, it can confuse you to the point where you’re not sure where to start.
First, let’s get familiar with the layout. After logging in, your first view will be the Home Dashboard.
Now, let’s break down each part step by step. On the left side, you have the main menu including these key sections apart from Home:
There’s another important section that you can see in the top-right section: Real-time data overview.

The Real-Time section lets you monitor live user activity. Here, you will see:
This is especially useful during events like product launches or marketing campaigns.
Now, that I’ve covered the basics, let’s break down the report section in detail.
This is where you’ll spend most of your time and the part that will confuse you the most. But, don’t worry! I’ll break it down into small parts.
The Reports section is organized like a library of your website’s performance. Here’s what you’ll find:
Life Cycle Reports
This shows your user’s journey from start to finish
User Reports
This gives you a clear picture of who your visitors are
Accessing Reports is really easy. Simply, click on Reports from the navigation menu and you will be redirected to a page with Reports Snapshot. On the left side, you can spot another navigation menu that will take you to Life Cycle Reports and User Reports.
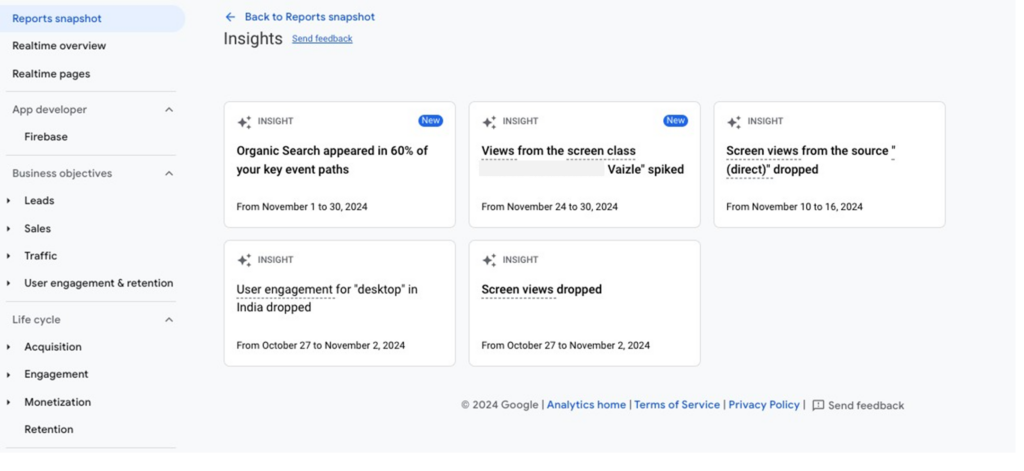
Reports Snapshot will also include an Insights section, that will give you a quick view of what’s working well and what can be improved.

When you’re just starting, you might feel overwhelmed by all the key performance indicators (KPIs) or metrics.
To avoid getting stuck in too many numbers while GA4 reporting, focus on these metrics:
Now, if your New Users number is continuously increasing but Events is not, you can conclude that new visitors aren’t engaging with your site as expected. This could mean they’re not finding the content or actions they were hoping for.

All this info at once can be confusing if you’re a beginner. To make it easy for you to explore GA4 basics on your own, here are some quick tips:
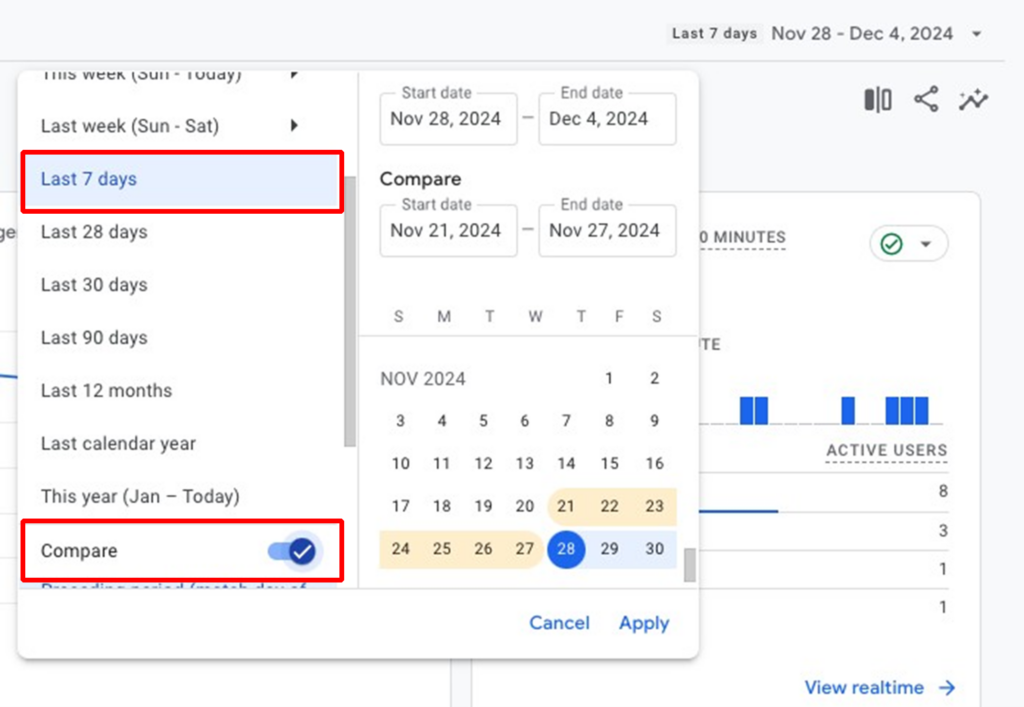
For example: if you want to compare the performance of the last 7 days with the previous 7 days, click the time period button on the top-right corner of the GA4 dashboard. Select last 7 days option and toggle the ‘Compare’ button.

GA4 works even better when connected with other Google tools. It’s like building a powerful ecosystem for your website data.
This connection helps you see which search terms bring visitors to your site.
Now you can see how your ads perform and track conversions more accurately.
If you’re using multiple tracking codes, Tag Manager makes life easier:
GA 4 is incredibly helpful and a must-have martech tool for business owners, SEO consultants, and marketing analysts.
But for beginners or team members new to analytics, navigating GA 4’s interface and extracting insights can be a challenging task.
This is where Vaizle’s Free Google Analytics (GA4) Tool comes in. This tool connects with your Google account and fetches key data pointers from GA4 into a simplified and easy-to-read dashboard.
For agencies and teams managing multiple websites, this means:
Google Analytics 4 is one of the most detailed web analytics platforms out there. Getting familiar with all its features and reports in one day is practically impossible. As you learn & explore, you will find hidden gems that will give you a new perspective regarding website performance.
Hopefully, this guide on GA4 basics cleared some key concepts and made you familiar with what is GA4. Moving forward, I will cover more advanced topics to help you dive deeper into GA4.
Stay tuned for upcoming guides that will simplify GA4 for you, step by step. And yes, if you found this guide helpful, don’t forget to subscribe to our newsletter.
GA4 is the latest version of Google Analytics, designed to track user behavior across websites and apps. Unlike Universal Analytics, it uses an event-based tracking model, offering deeper insights into user interactions and better integration with privacy regulations.
Yes, GA4 is free to use for most businesses. However, if your site generates a very high volume of traffic and you require advanced features, you might need to explore Google Analytics 360, which is a paid version.
To upgrade, log in to your Universal Analytics account, navigate to the Admin section, and select “GA4 Setup Assistant” under the property settings. Follow the prompts to create your new GA4 property.
Yes, GA4 integrates with Google Ads. You can track ad performance, conversions, and user journeys across platforms to optimize your campaigns and improve ROI.
GA4 offers improved cross-platform tracking, better user privacy controls, and machinelearning insights that predict trends. It also allows you to track more detailed user interactions, like button clicks or video views, without extra setup.
Arushi is a proficient SEO and ASO specialist with a 5-year track record working for B2B and B2C organizations. Currently, she is heading SEO strategy for Vaizle and helping businesses improve their online presence. A mountain girl at heart, she likes to recharge her creative abilities by taking long walks and listening to podcasts.
Copyright @VAIZLE 2026