Wondering if your Facebook ads are working for you? Confused about which metrics you should be tracking?
Facebook ad Analysis helps you to better understand how your Facebook ad campaigns are performing.
Facebook Ad Analysis: What Is It?
Using Facebook Ad Analysis, you can determine how well a campaign is performing. It provides precise data on marketing initiatives and evaluates paid media (CTRs, impressions).
Numbers don’t lie, and that much is true. They clearly show what is working, what needs improvement, and what needs to be changed.

We created the Vaizle Facebook Ad analysis tool with this in mind. Get useful, actionable, real-time insights from your active Facebook ad accounts and track the metrics that matter the most to your campaign goal. Campaign metrics that you can track and visualize with the Vaizle Facebook Ad Analysis tool are:
Whenever any of these metrics are declining, you should adjust your ad campaign strategy to increase ad engagement and conversions.
The strongest reasons why you should use Facebook Analytics are:
As soon as your ads go live, you can start monitoring their performance with the Vaizle Facebook Ad analysis tool. This platform will assist you in analyzing your ad performance.
The tool enables traffic segmentation, analysis of each ad set separately, Product analysis, audience analysis, Conversion funnel, easy reporting, and the gathering of more relevant data.
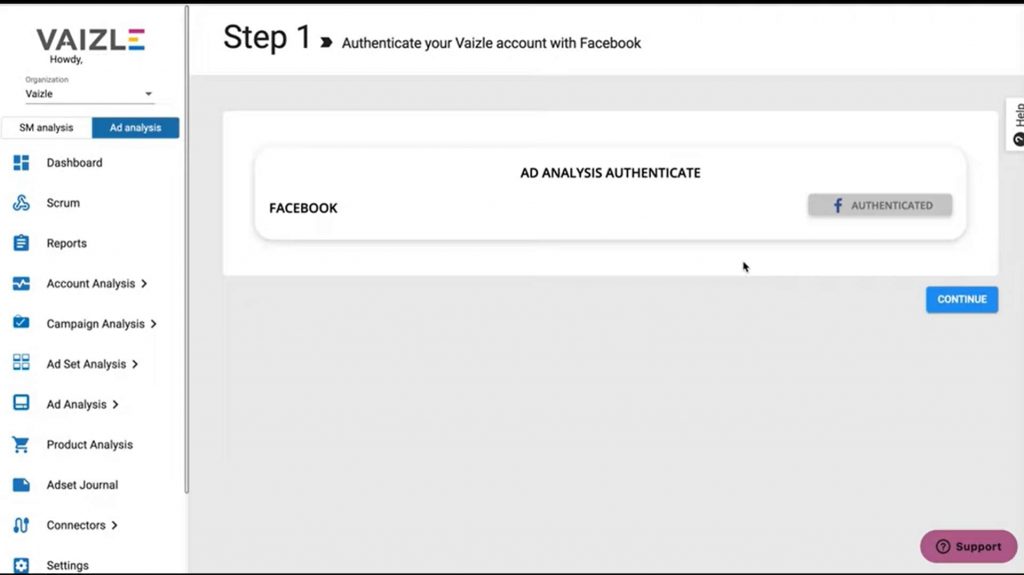
Authenticate your ad account so that you are able to fetch all the data from the ad accounts that you own.
If you are already logged into your Facebook account in your browser, simply click “Authenticate” and it will automatically fetch details and authenticate your account.
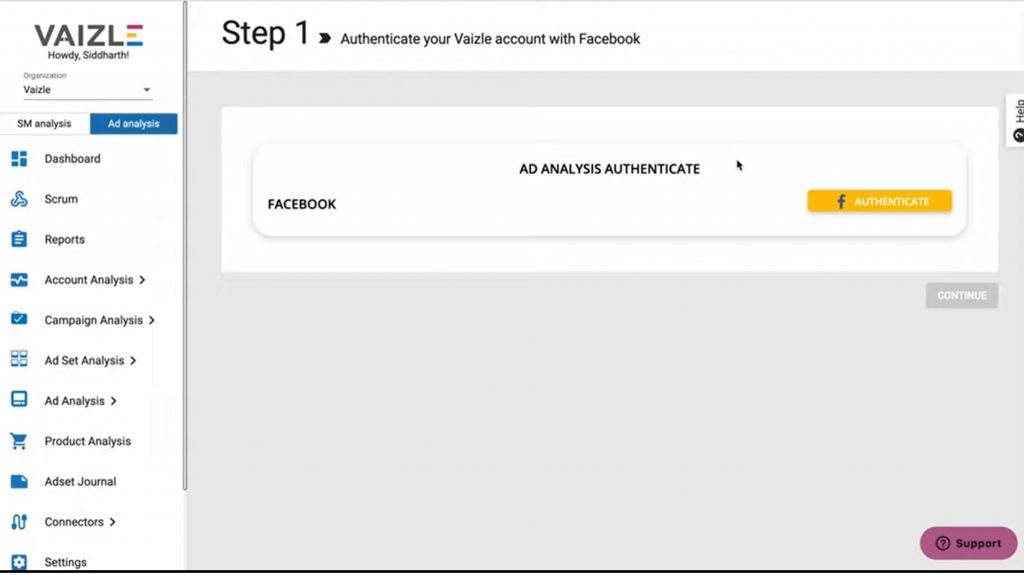
In case you are not logged in, it will ask for login credentials and then proceed to authenticate.
The next step is to add an Ad account to the Vaizle FB Ad analysis tool. Click on “Continue”.
Next, click on “Add a Facebook Ad Account” and all the ad accounts that you own will be listed in a popup.
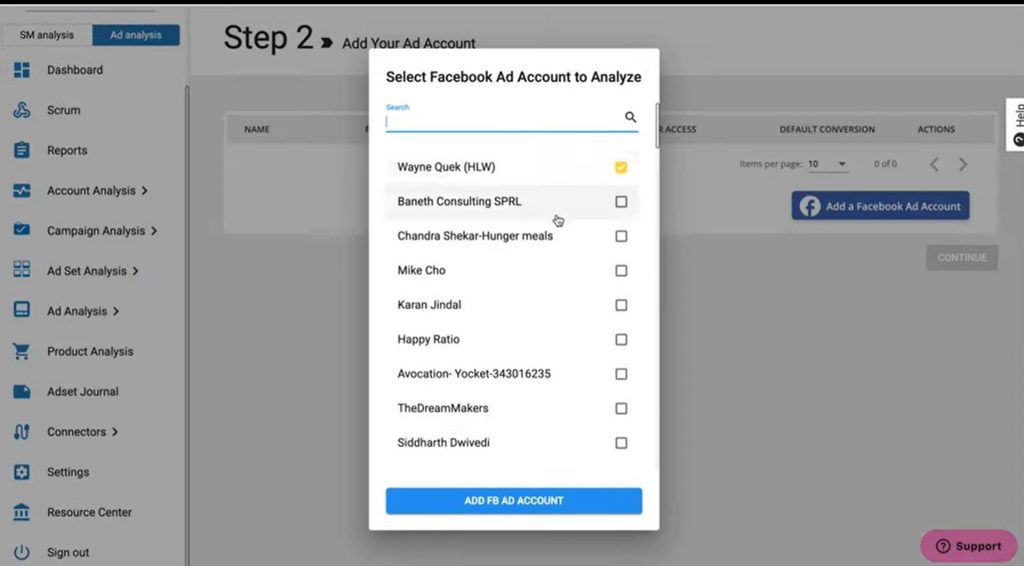
You can add one Ad account at one time. You cannot select two or more Ad accounts at the same time.
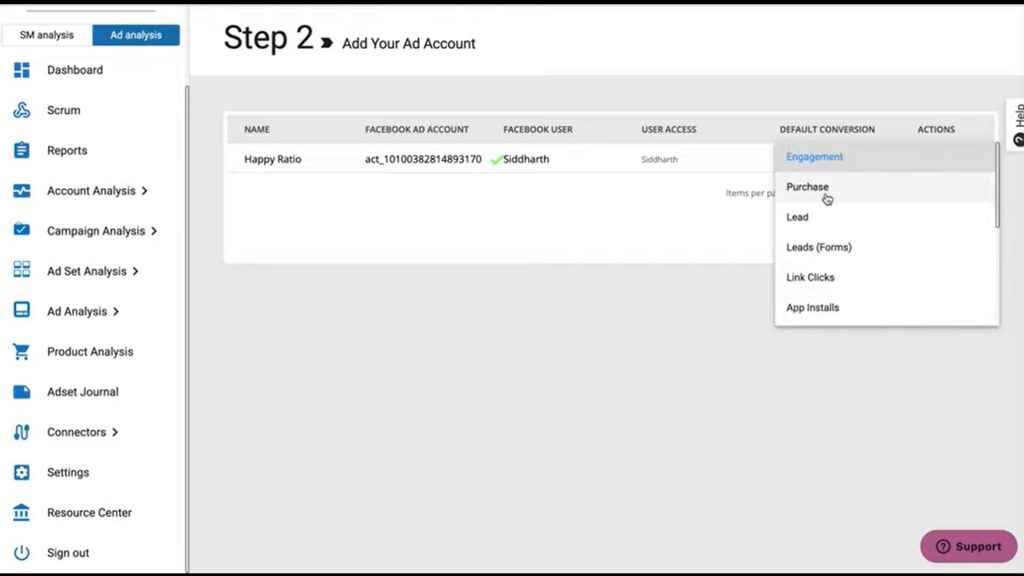
Once you see the desired Ad account added to your Dashboard, you must choose “Default Conversion”.
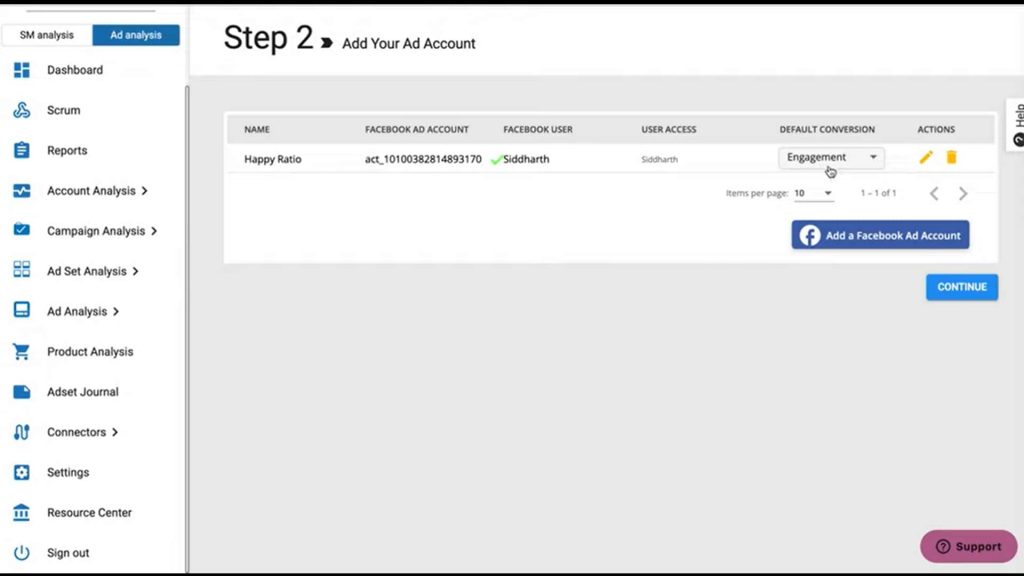
Default conversion is a metric or the objective for which you want to track this particular Ad account. You can change it anytime along the way. Even the custom conversion which you have created especially for that particular Ad account will be available. You can select any for tracking.
Click on Continue to see the performance of that Ad account.
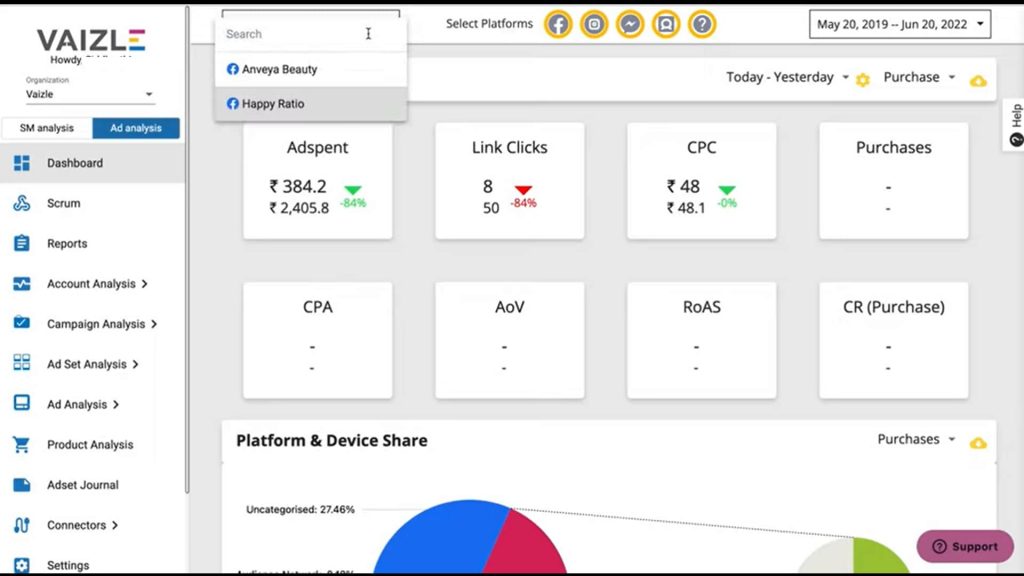
If you have more than one Ad Account added, you can switch between them anytime from here. You can switch between client dashboards very easily, and compare an ad platform and its metrics with another – all in one place.
The dashboard is designed for performance marketers to use on a day-to-day basis. The dashboard shows you the performance of individual ad campaigns and compares it to previous reporting periods.
The account overview section on the dashboard is a comparison between today and yesterday by default. But you can also set it to do the comparison between this week and last week or This-Month – Last Month too.
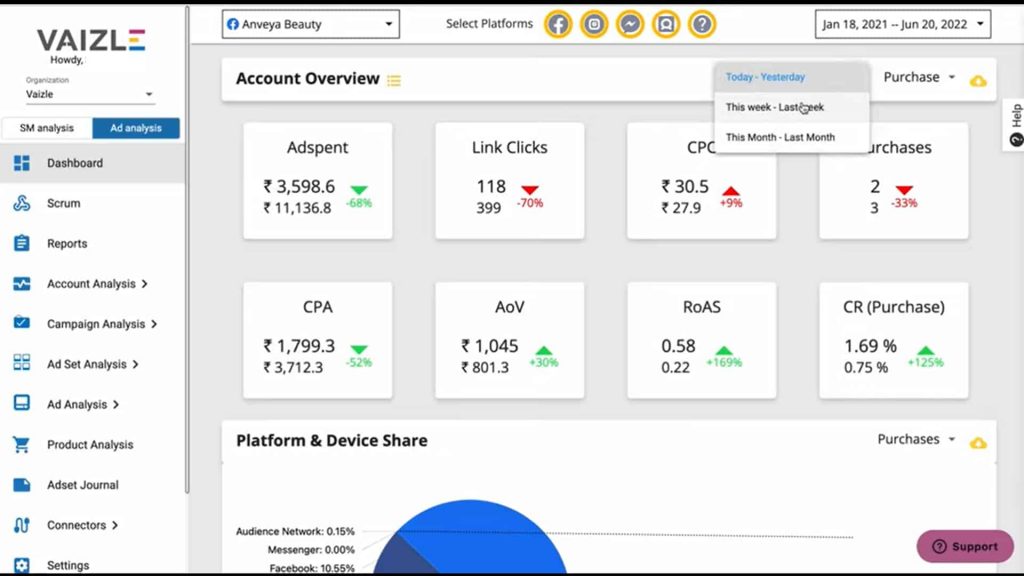
Every conversion that you select has a different dashboard. Each is set with default metrics. You don’t have to create on your own. You can see all the critical performance metrics in one place using our pre-built dashboard for Ad Analysis. Ad set metrics and budgets can be tracked in real time and in one place. It is easy to implement and saves hours of manual work.
For example, if you select the default conversion as “Engagement”, a new dashboard with different metrics is loaded.
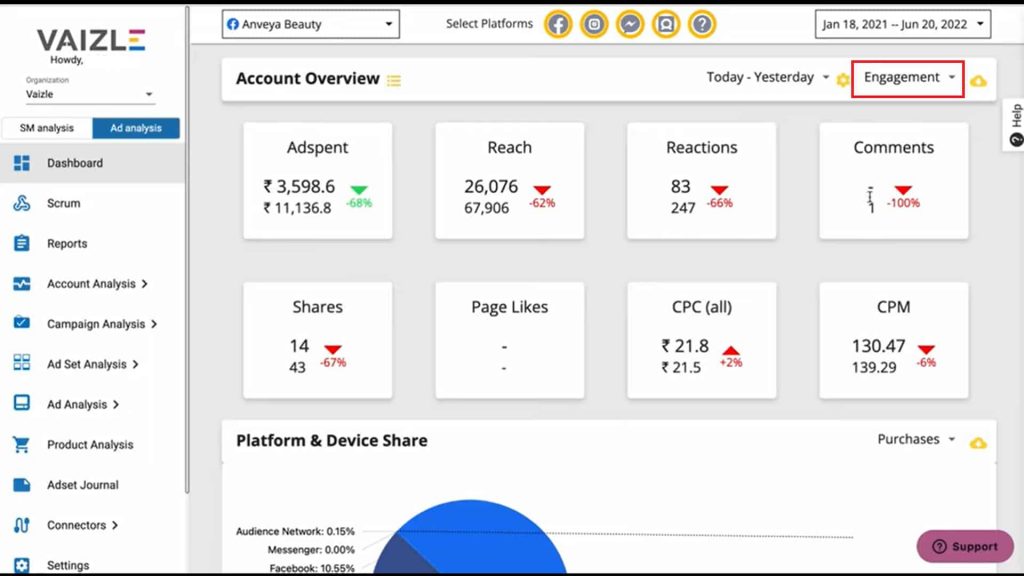
This dashboard is designed to be used based on what conversion you choose. If you scroll down, you will see the Platform & Device Share, Weekly Analysis, and Conversion Overview.
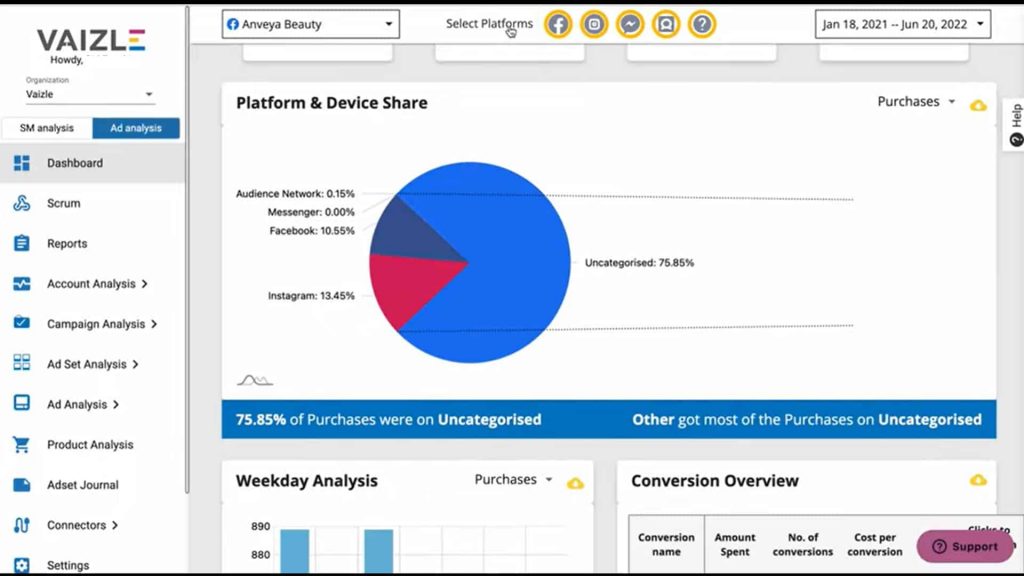
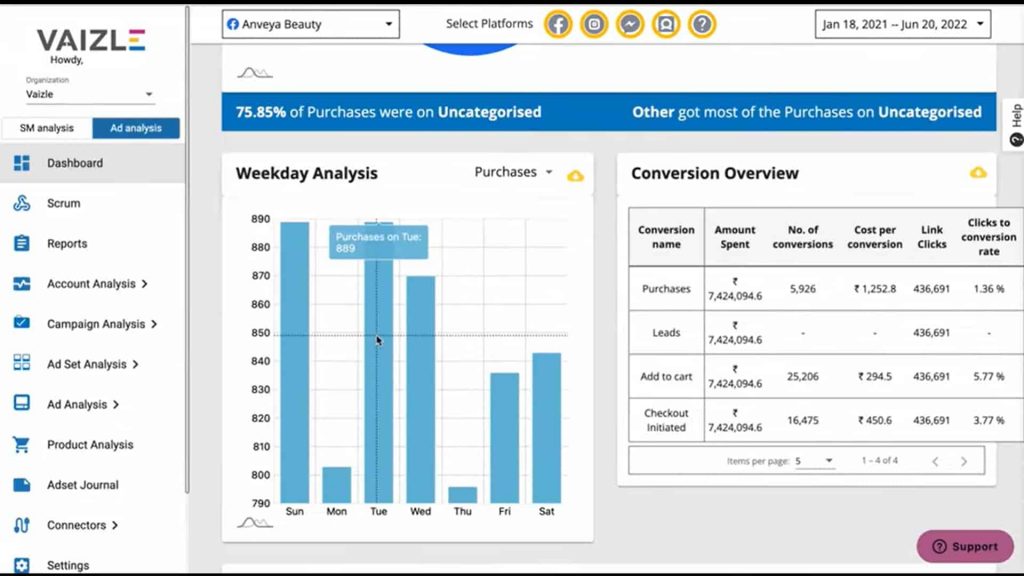
You can not only see the performance on a day-to-day basis but do much more with this tool.
You’ll want to know how your ad campaign is performing after you launch it.
Facebook ads are itself is designed into four different layers:
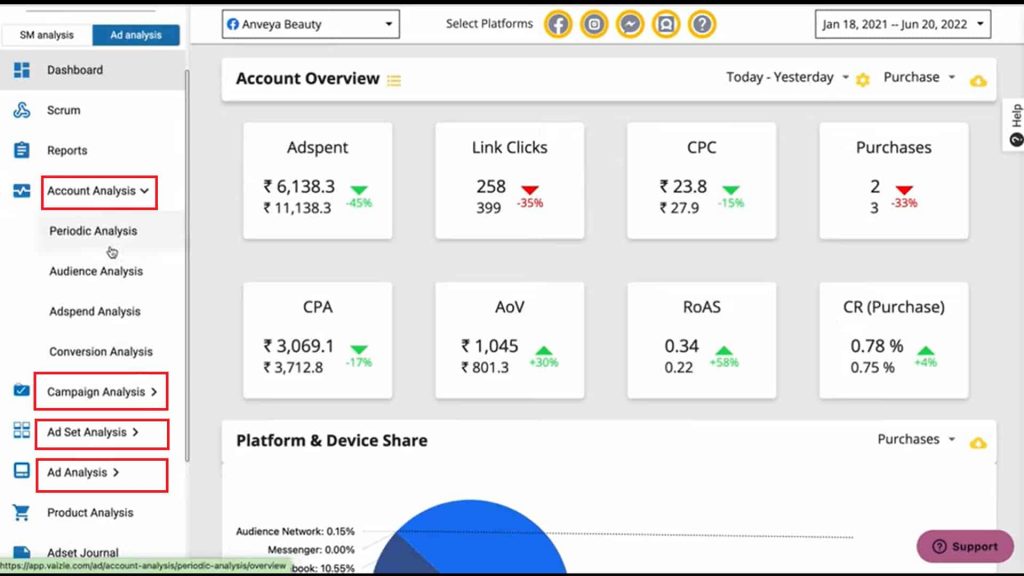
It’s a good thing that Vaizle’s Facebook Ad Analysis tool has a feature that lets you view statistics by Account, Campaigns, Ad sets, or Ads. Because this application offers both historical and real-time data, you may find out not only how well your past efforts performed but also how people are responding to your present campaigns.
You can quickly grasp the performance of an ad campaign by looking at your ad performance metrics. The FB Ad Analysis tool by Vaizle offers valuable information that may and should be applied in the design of your upcoming campaigns.
Within all these four sections, you have four similar kinds of sections called:
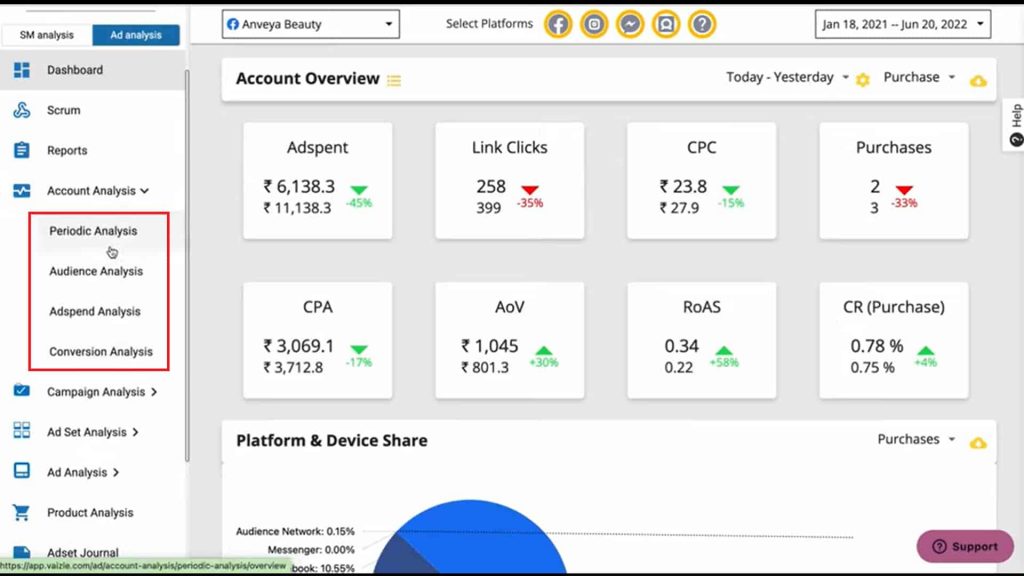
Let’s take the broad category Account level and discuss all the four sections inside it.
In the periodic analysis section, we can see the overall account’s performance for the conversion we have selected. All the campaigns that are happening in this Ad account, have been put together here. This simple-looking analysis is very difficult to do on Facebook. It would require a lot of filters strategically to reach this number. Along with the overview, you can go for the Daily, Weekly, Daywise, Monthly, or Weekday Analysis.
This tool is designed to help you figure out how your Ad spending is happening across different audience demographics like Age, Gender, Country, Region, Platform, and Placement.
Audience Analysis helps you understand your audience better.
Compare your Ad spend with this smart analysis across different segments; in this particular case Age. Compare it with other metrics like Engagement, Link Clicks, etc. You can even change the dimensions here for comparison, again choosing between Age, Gender, Country, Region, Platform, and Placement.
Get a better outlook of how your ad is spending across different dimensions or sections of the audience.
Conversion Analysis is designed to help you see the impact of your Ad spend and analyze your funnel step by step. The tabular data shows your all conversions from clicks to actual purchases. It will help you get an overall understanding of what is happening across the funnel. Hence you can make more informed data-backed decisions where exactly in the funnel you should make more effort.
Product analysis is the most innovative feature of the Vaizle Ad Analysis tool. Product analysis is designed to help you see the performance of your product catalogs.
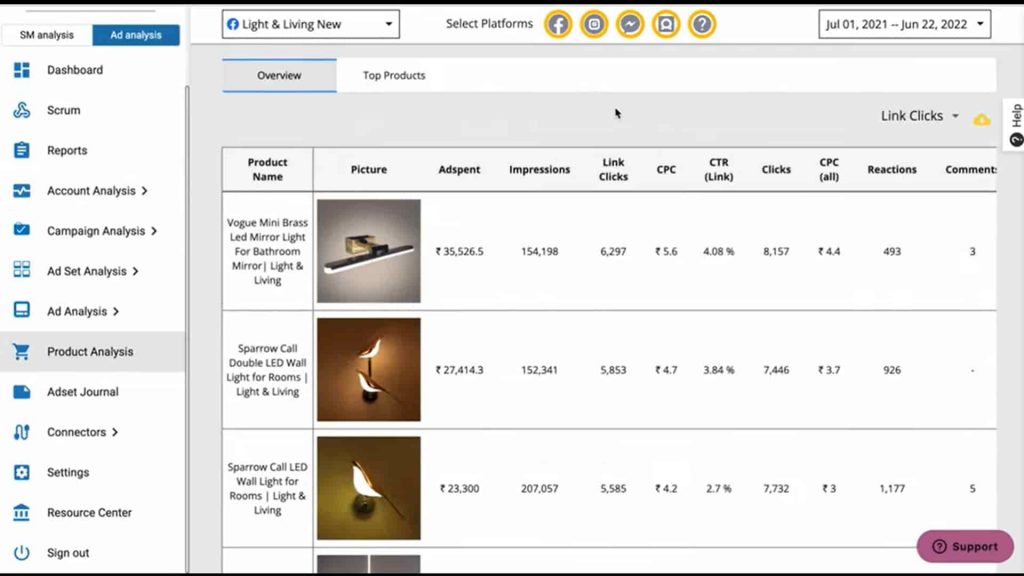
Let’s understand how this work exactly.
For instance, you are running a product catalog with 1000 SKUs or even more than that. You never find from any other tool, which product is getting what kind of ad spend, what is the CPC of that particular product, what is the CTR etc.
You are running the ad campaign based on what conversions you are getting. There is no scope to optimize your product catalog.
Now with the Product analysis feature of Vaizle, you can see the actual Ad spend on all of the products individually and their individual performance.
You can even sort the table according to Ad spend, Link Clicks, CTR, and CPC.
This also gives you a clear list of which products haven’t been tested at all.
You can use Vazile to optimize your ads based on the products in your catalog. This tool is going to be extremely valuable if you are an eCommerce advertiser or marketing agency handling eCommerce clients or DTC brands.
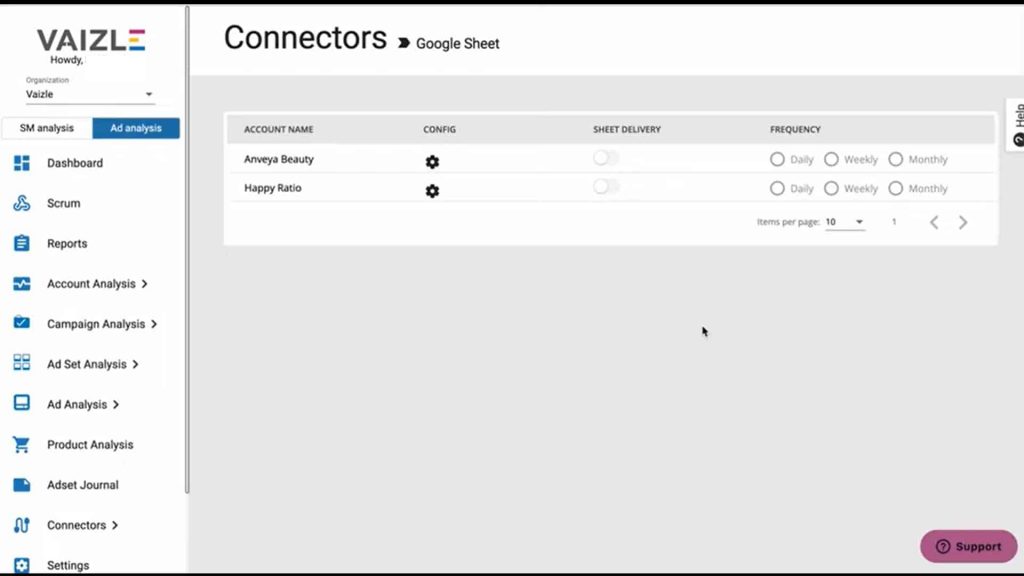
Vaizle presents another innovative feature that allows you to fetch data from Facebook ads into your Google Sheets. You don’t have to manually enter the data every single day.
With the help of Google Sheets in Connectors, you can fetch data from any of your Facebook Ad accounts into a Google sheet.
Click on the “CONFIG” icon and a pop-up will appear with various options.
You have to just enter the link for the Google sheet and sheet name. Select the Analysis type and choose the period for which you want to fetch the data.
You also have an option to “Add spreadsheet” to an already existing Google Sheet.
With this feature, you can get all the performance data for your Ad account in a report format in your email inbox. That’s how easy it is to get daily notifications about your account’s performance.
You can check the appropriate option if you want to update your data every day or refresh it on a weekly or monthly basis.
Create customized white-labeled reports for your clients or superiors with few clicks. Go to the “Reports” section, and click on “Build New Report”.
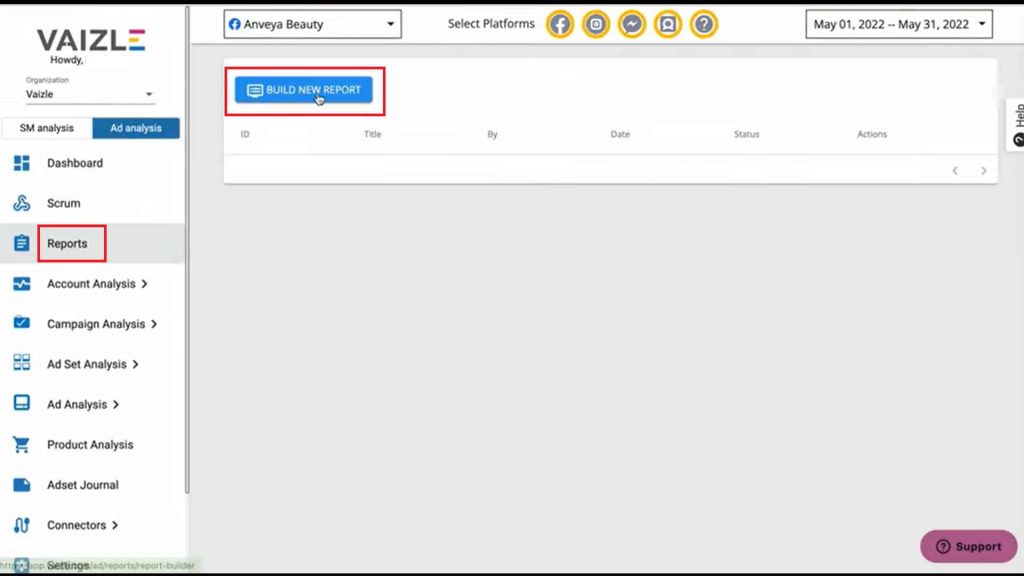
There are many beautiful templates to choose from. Simply edit the columns with your own details like the Name of the report, time frame, logo, etc.
You have the option to add as many metrics and analyses as you want. All the data will be automatically fetched into the report.
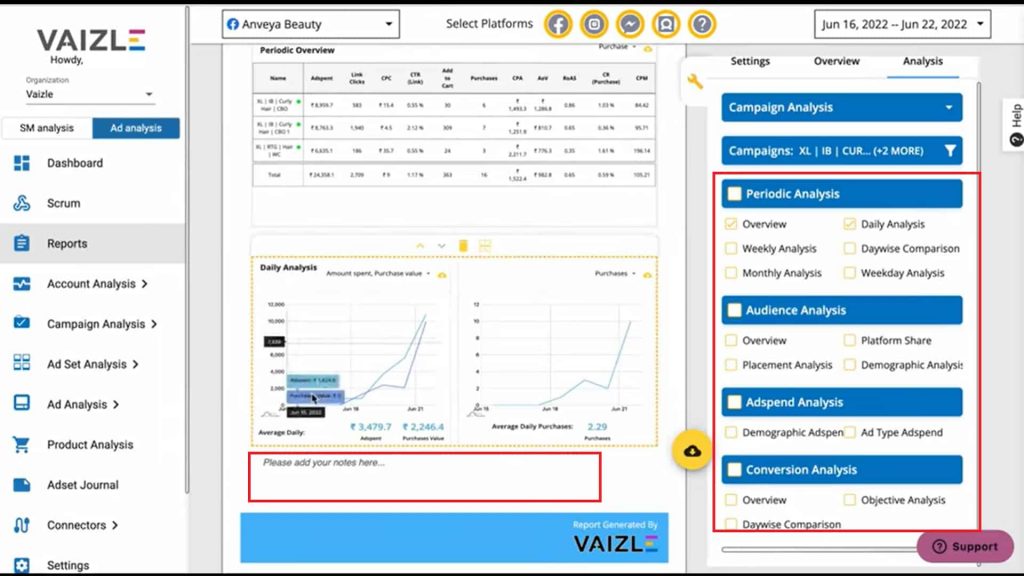
There is a great feature to add your own notes to the report. Once you click on the download the report icon, within a few seconds your customized report is ready and downloaded. You save tons of time by using this report builder.
Scrum is designed to help you understand the performance of all your ad accounts in a single place. If you go on Facebook Dashboard, you are not able to see all your accounts’ performance in a single place.
You might be managing ten different accounts or even more. It becomes extremely difficult to keep track of the performance of your account.
Scrum is designed in a way that every single day that you come to your office or start your day, you just need to scroll this particular page and you will have access to all the accounts in a single place.
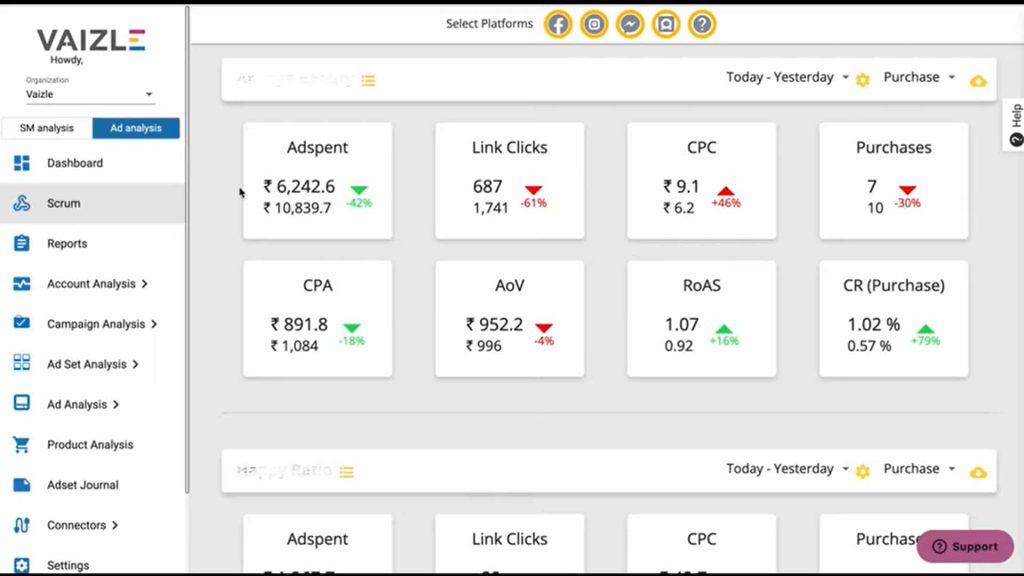
You can also choose to see this data in a tabular format which gives you a more holistic view of accounts’ performance.
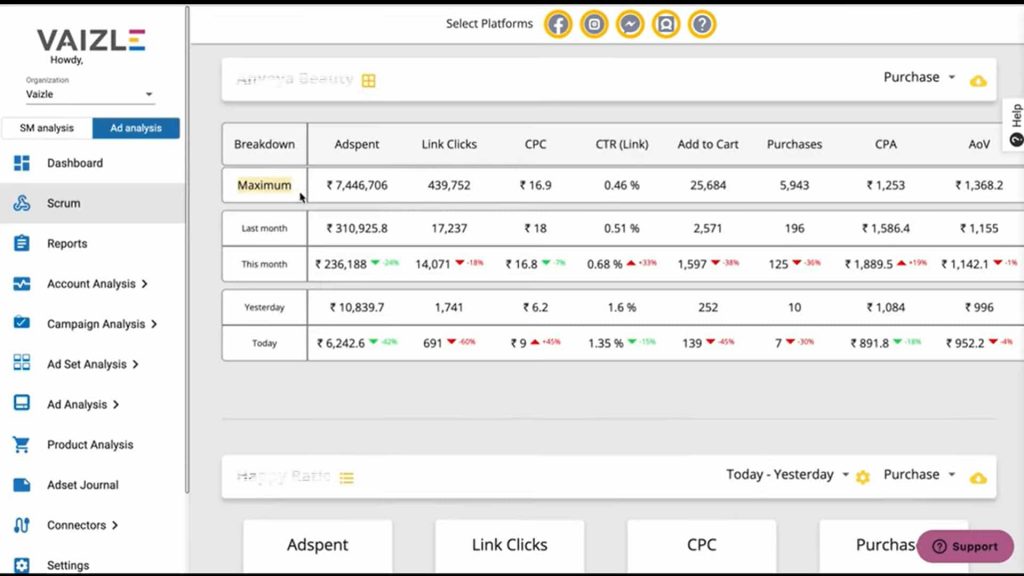
The information Facebook Ad Analysis offers can help businesses track the success of their advertising efforts and make better decisions in the future. You can develop advertising and ad campaigns with specific objectives in mind by using the data provided by Facebook Analytics, which will increase your ROI.
Keep in mind that there is no one-size-fits-all approach to digital marketing. Always put your ideas to the test, and keep engaging your viewers. As Facebook’s features, audiences, and algorithms developed over time, Facebook advertising is always changing.
Contact us if you have any queries or would want to talk with a marketing expert. Making data-driven decisions is something we want to help you do for your business.
Arushi is a proficient SEO and ASO specialist with a 5-year track record working for B2B and B2C organizations. Currently, she is heading SEO strategy for Vaizle and helping businesses improve their online presence. A mountain girl at heart, she likes to recharge her creative abilities by taking long walks and listening to podcasts.
Copyright @VAIZLE 2026