Look around and you’ll realize that everything is powered by data! From social media post recommendations to weather forecasting, everything today majorly relies on it. (btw that’s probably why global data volume is all set to reach 180 zettabytes by 2026)
But data in itself can be irrelevant unless you analyze it to retrieve meaningful insights by carrying out detailed data analysis. It is useful for identifying repeating patterns and solving problems with a logical approach.
But what does the whole data analytics process actually entail and how to do data analysis? In this guide, I will start from basics — briefly explain the process, its importance, different types, and steps to perform. So, let’s familiarize ourselves with data analysis a little bit better.
Data analysis is the systematic process of extracting, examining, filtering, transforming, and modeling data using different statistical and logical approaches. The core reason for conducting data analysis is to identify trends and patterns in the dataset and solve problems at hand accordingly.
Based on your requirements, data analysis can either be conducted on quantitative or qualitative datasets. For quantitative data, consider spreadsheets containing the latest sales or marketing metrics, and for qualitative data, you can include case studies, surveys, interview transcripts, or personal narratives.
By examining data based on overall customer purchasing behavior (product preferences, purchase frequency, popular items, and more), companies can forecast demand, personalize product recommendations, and refine ongoing operational strategies.
To summarize in brief, you can say that data analysis is translation of numbers and data insights into actionable information.
Now that we know a bit about what data analysis is, let’s check out different types and techniques.
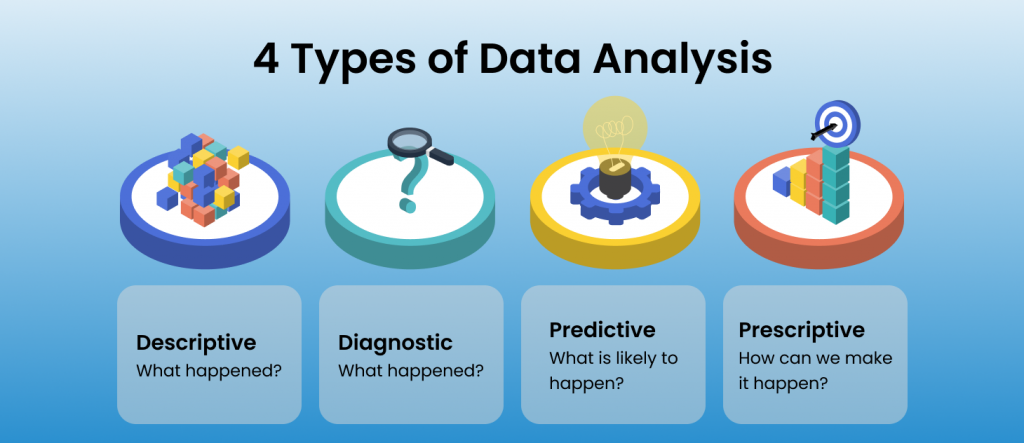
Generally, data analysis is classified into 4 types — descriptive, diagnostic, predictive, and prescriptive. Let’s know a bit more about each of them and how they can help refine your working process.

The first and most basic type of data analysis is descriptive, where the main goal is to present a clear and concise summary of the main features of the dataset. In a way, descriptive analysis helps create a brief overview of what happened in the past.
Example: Check the COVID-19 statistics presented by Google. Here, you will see a line graph highlighting new cases and deaths, with a 7-day average for each day.
If you want to figure out the root cause of problems, diagnostic analysis is the way to go.
Diagnostic analysis (as the nomenclature suggests) helps you understand why something happened and what was the reason behind it. Based on this information, you can discover and deal with new problems much more efficiently.
Example: A meal kit subscription company, Hello Fresh, adopts a data-driven approach for establishing a correlation between customer attributes and behavior. This analysis helps them modify the supply chain and eliminate intermediate steps in the entire product cycle.
Predictive analysis answers the question of what is likely to happen and is basically used to anticipate any future events.
It uses technologies like Machine Learning and Artificial Intelligence to make predictions based on the input variables. Keep in mind that the accuracy of statistical modeling here will directly depend on the quality of input data and how detailed it is.
Example: Researchers (at the University of Sheffield, University of Pennsylvania, and UCL) used NLP (Natural Language Processing) to conduct data analysis of publicly available legal texts. Based on this analysis, they were able to predict the decisions of the European Court of Human Rights (ECtHR) with a 79% accuracy.
Prescriptive analysis is perhaps the most important type and uses data insights from all previous analyses to determine the future course of action. It can be used in two ways — either to deal with an ongoing problem or to leverage an upcoming market trend.
This data analytics process is currently used by global leaders like Netflix, Apple, and Facebook to improve their decision-making process.
Example: An experiment conducted in venture capital space revealed that an algorithm performed better than novice angel investors in making investment decisions (backed by the same data available). Read more at Harvard Business Review.
Making assumptions and making data-backed decisions are two different things. If you’re not doing the latter, you might as well be moving blindly.
Here’s why you need to focus on data analysis for your business:
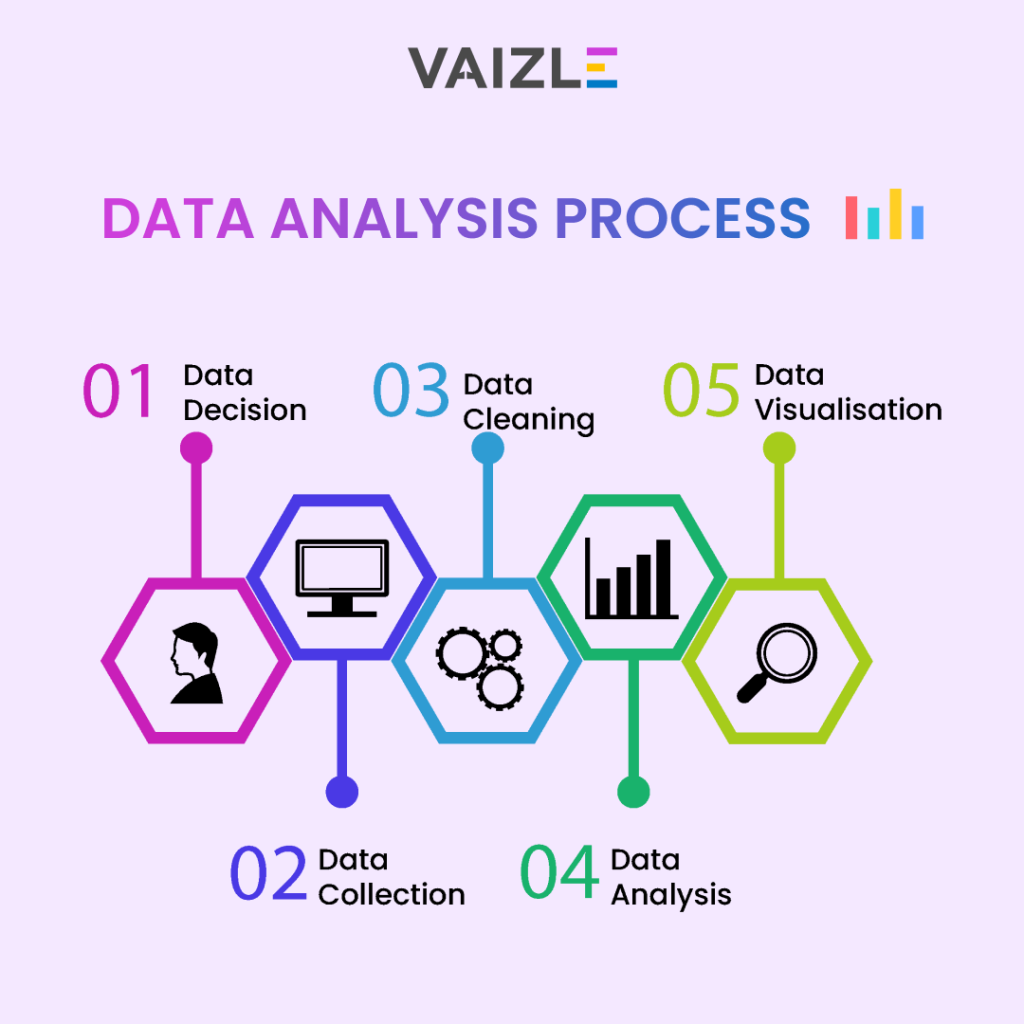
Simply analyzing data isn’t sufficient. The data analysis process itself contains multiple steps before and after the actual analysis is conducted.

Let’s check out the different stages of the data analysis process:
Before beginning with data analysis, you need to find out what actually it is that you’re trying to solve. In technical terms, you can call it the formation of a ‘problem statement.’
Remember to get specific here. You should know exactly which problem to target and how to figure out a solution for it. For example: a D2C business might want to figure out the reason why they are losing customers.
But the actual problem statement in this case might be — how to improve customer retention or what factors are negatively impacting customer satisfaction?
Once you have finalized the objective or decided which operational area to focus on, start collecting data from different sources.
Data to be retrieved can be roughly divided into 3 categories: data from your company, second-party data (for e.g.: from your consumers), and third-party data (for e.g.: government sources or surveys).
To avoid the hassle of manual data collection, you can rely on the latest data extraction software.
If you are running a marketing agency, you will need to collect ads data from various social channels. Free connector tools by Vaizle can help you automate the process within seconds. For example: if you want to get Facebook ads data in a Google Sheet, using the Free Facebook Ads to Google Sheet Connector tool can help save a ton of time!
Did you know that an average business’ data decays at a rate of 30%?
This implies that all data retrieved from various sources isn’t meaningful for you. In these datasets, you will also find whitespaces, null values, irrelevant metrics, and outdated information.
Data cleaning is the process of discarding unwanted data points and testing the entire document for maximum accuracy.
Remember — data hygiene is extremely important and can help you bring closer to maximum algorithmic accuracy.
Jumping to the most important step and focal point of today’s discussion: data analysis.
With clean data, you can now move forward with any of the above-listed data analysis types to extract valuable insights and identify patterns.
If you’re new to coding, a beginner-friendly Python course from DataCamp can equip you with the basics of data manipulation, visualization, and exploratory analysis in Python.
Your data analysis process could be as simple as linear regression or as advanced as artificial intelligence. It depends on your overall goals and tools available at hand.
Plain data is hard to decipher.
Imagine having to go through hundreds of spreadsheets to find a data pattern — tough to even think about it, right?
That’s where data visualization comes in. Once the data is analyzed and ready to be presented to decision-makers, you can put it in the form of tables, graphs, charts, and interactive dashboards. Doing so will help improve data comprehension substantially.
And what better way to visualize your data than with Vaizle? Here, you get the best of all: graphs, pie charts, a live dashboard, and whatnot! Since the list of features is too long to write here, why don’t you give it a go?

From what we’ve learned so far, data analysis is the process of collecting, filtering, examining, and transforming data to yield useful insights. It can help make predictions, optimize processes to improve efficiency, spot anomalies, and so on.
To be honest, data analysis is a vast (not exaggerating at all) process and to learn all about it in a single blog is practically impossible. But hopefully, this information was sufficient to get you interested in it and dig the internet deeper for more!
Till then, maybe you’d like to give some interesting social media statistics a read.
Mamta is an SEO Analyst with 3 years of experience. Currently, she is spending her time on content roadmapping to drive organic growth and engagement for SaaS businesses. Mamta is also an avid cinephile who spends her spare time watching latest action and sci-fi flicks from around the world.
Copyright @VAIZLE 2026